Dynamic multichain graphical models (DMGM) for the analysis of childhood obesity data
Wake Forest University (VCU)
Project Title
Dynamic multichain graphical models (DMGM) for the analysis of childhood obesity data
Research Question
The proposal contains three specific aims:
- Develop a set of analytical tools, including the following two specific methods, for the analysis of multilevel childhood obesity data: (a) the temporal decision tree (TDT) for the identification of risk factors, and (b) the Dynamic Multi-chain Graphical Model (DMGM) for multilevel, mechanism-based inference.
- Apply the proposed methods to data sets from the LA Child Health Study (PI: Don Williamson) and the Heartbeat! Project (PI: Darwin Labarthe), respectively.
- Disseminate research results, as well as software programs and documentation.
Modeling Approach
- For the purpose of the study, the temporal decision tree is designed to extract important variables within a system. It is a tree-based method that extends traditional modeling tools such as CART and C5.0 to a longitudinal setting and include sequence data analysis. The program has been developed and the graphical user interface component is in progress. Figure 1 shows screen shots of the graphical user interface of the TDT program.
- Briefly, the DMGM is a statistical modeling approach that puts the primary variables of interest of a system into a special dynamic Bayesian network framework that allows multiple chains, plus a set of regulatory variables that resembles the covariates in a regression equation. The difference between the DMGM and regression is that DMGM contains more than one dependent variable and the variables are linked together via a graphical model, which suggests possible causal mechanisms between variables. One the other hand, the independent variables are modeled as "regulatory variables" for the system using a generalized linear mixed model framework. So far we have successfully added several features into DMGM, which has been built upon an earlier version of an extended hidden Markov model : (1) generalized linear mixed effects models (GLMM) for the graphical model that incorporates both fixed and random effects into the graphical model ; (2) an augmented junction tree algorithm to compute standard errors for the DMGM; (3) both continuous and categorical variables as manifest variables; (4) partially ordered data; and (5) multiple chains, each representing the trajectory of a specific obesity profile.
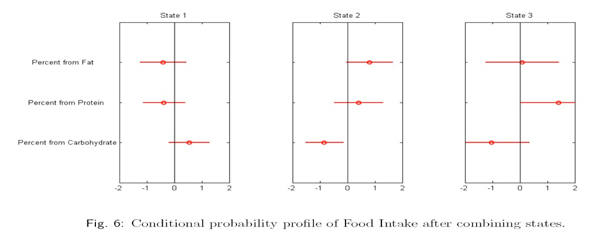
- We have created multiple obesity-related social and behavioral profiles from the Louisiana (LA) Child Health Study. From the longitudinal data collected on a sample of elementary and high school students (N=2,101), we identified relatively homogeneous groups for each profile. The following figure shows three such groups for a "food intake" profile. The DMGM approach links several such profiles together as multiple chains and models the dynamics of changes across the profiles over a period of three years.
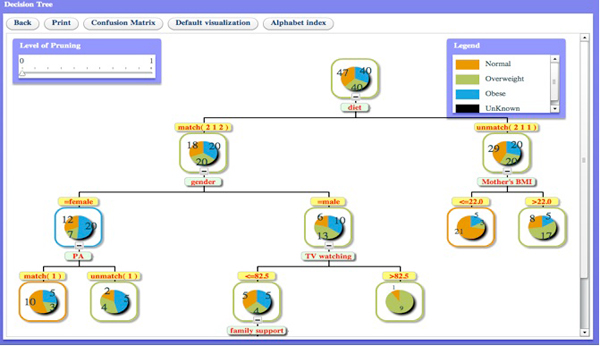
Figure 1a. Screenshot of TDT output for sequence data
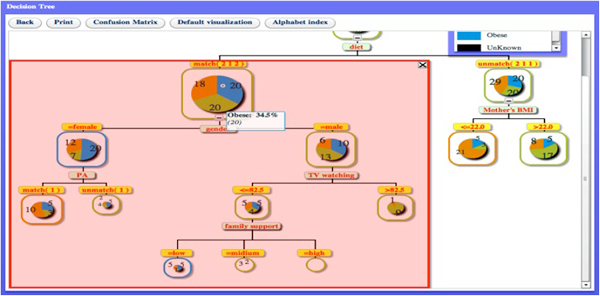
Figure 1b. Screenshot showing a feature that allows node size to vary according to sample size.
Principal Investigator
Edward H. Ip, PhD
Wake Forest University School of Medicine
Co-Investigators
Janet Tooze, PhD MPH
WFUSM
Robert Schwartz, MD
WFUSM
Iris Leng, MD PhD
WFUSM
Marek Druzdzel, PhD
University of Pittsburg
Yukinobu Hamuro
Kwansei Gakuin University, Japan
A collaboration among: ![]()
![]()
![]()
![]()