Section
2
Overview of Body Composition and Measuring Adiposity
Body composition describes the relative proportion of fat mass (FM) and fat-free mass (FFM) in the body.
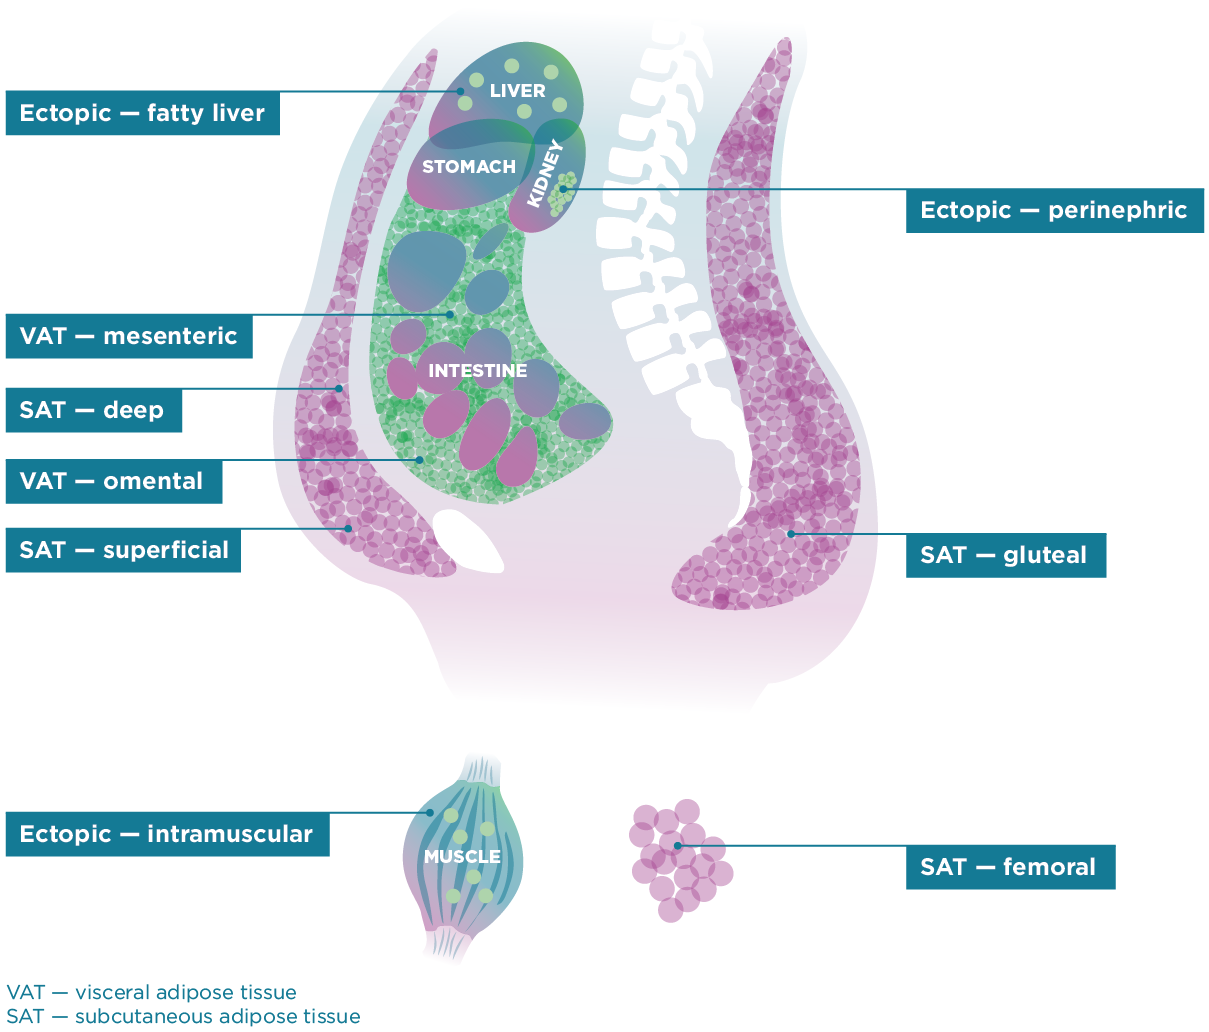
FM encompasses the adipocytes (fat cells) in adipose tissue (fat tissue) as well as fat deposits found in various other cells and organs in the body. Body fat is stored in adipose tissue in many locations throughout the body such as under the skin (subcutaneous), in the abdominal cavity surrounding internal organs (visceral), between muscles, and in the bone marrow (Figure 1). Fat cells also can deposit in locations other than adipose tissue (ectopic) including within organs such as in the liver, skeletal muscle, and heart. FFM consists of muscle, bone, and internal organs as well as body water compartments. Most of the body’s water is stored in the tissues of FFM, and FM is assumed to contain little water. Fat-free mass has the highest water content during the first year of life at ~80%. Water content decreases during growth, plateaus at ~73% in adolescents, and remains relatively stable at 73% of FFM throughout adulthood.1 Fat-free mass does not contribute in a measurable way to the amount of total body water (TBW) nor to the estimation of TBW.
Figure 1: Adipose Tissue Depots
Measuring Body Composition
The measurement of body composition at the simplest level refers to the measurement of the body’s fat mass and fat-free mass components.
Body weight is the sum of FM and FFM. Increased body FM has been associated with a variety of diseases such as heart disease, some forms of cancer, and diabetes.
Accurate measurement of body fat mass can help explain how increased fat mass as well as the location or distribution of that increased fat mass may affect health and increase risk of complications from specific diseases later in childhood and in adulthood.
Simple, accessible, and accurate methods for measuring body FM directly in human beings are not available because use of such direct measurement methods would harm a person. For these reasons, researchers and practitioners use indirect and surrogate measures to estimate body FM in living persons. Indirect measures are based on the premise that established relationships exist between specific body components. Obesity in children and adults is most often defined using body mass index (BMI, kilograms divided by meters squared). In children, BMI varies by sex and age, so unlike in adult BMI, children must be compared to a population of the same sex and age. Many growth charts exist. Some growth charts reflect growth standards and are based on data that assumes optimal and desirable growth in children based on selection of children meeting criteria such as breastfeeding, term birth, access to health care, etc. Others reflect a growth reference and are based on data from a specific reference population, often a country, at a point in time. Simply, a growth standard shows how children should grow, while a growth reference shows how they do grow.2
The 2000 Centers for Disease Control & Prevention (CDC) Growth Charts were developed from a reference population of children in the United States aged 2–20 years and are comprised of data from six cross-sectional nationally representative surveys of children during the years 1963 to 1994. The World Health Organization (WHO) has released growth charts or growth standards for infants and young children aged 0–59 months based on sites and individuals who met a number of specific conditions related to feeding, term birth, and other factors thought to support optimal growth. Data were collected from sites in six countries. In 2007, WHO released growth charts or growth references for older children that were based on U.S. data with exclusions based on high body weight but have been smoothed to align with the WHO growth standards for younger children. Many other growth charts are available for individual countries. In addition, growth charts are available for children with specific conditions that affect growth and growth rates, such as for children with Down Syndrome.3 These condition-specific growth charts compare the growth of an individual child who has the condition to a sample of peers of the same age and sex who also have the same condition.
The CDC has provided guidance to health care providers on when to use the CDC and WHO growth charts. (See Growth Charts). Additional information on the development and use of these growth charts can be found in the following resources. (See 2000 CDC Growth Charts for the United States: Methods and Development and WHO Child Growth Standards Based on Length/Height, Weight, and Age) In the United States, a free, online BMI percentile calculator for Child and Teen calculates BMI and the corresponding sex specific BMI-for-age based on the CDC growth charts for children and teens. For children younger than age 2 years, sex specific weight-for-length is used to assess body weight in relation to recumbent length.
Defining Overweight and Obesity in Children
Experts have not yet identified or agreed upon a definition of obesity that uses an absolute cutoff or threshold for increased body fat mass during childhood.
This is due in part to the lack of empirical data that relates FM to health and disease outcomes for children and adolescents. Instead, overweight and obesity are defined statistically by the BMI-for-age or weight-for-recumbent length percentile values that exceed the level considered normal for a child of a specific sex.
For children and adolescents aged 2–19 years, BMI is compared to the distribution of BMIs from a reference population to yield a BMI percentile based on age and gender, rather than a single absolute value of BMI. For infants and toddlers, weight is compared to the distribution of weight from a reference population to yield a weight-for-length percentile, rather than a single absolute value of weight. The percentile cutoffs are intended to most reliably, and with the least amount of error, define a level above which a child is more likely to have or be at risk of developing obesity-associated adverse health outcomes or diseases.
Based on available data, an expert committee comprised of representatives from 15 professional organizations defined overweight in children aged 2 years and older as the 85th to <95th percentile of BMI for age and sex, and obesity as BMI ≥ 95th percentile or an absolute BMI ≥30 kg/m2, whichever is lower based on age and sex using the reference population from the 2000 CDC growth charts.4 In addition, CDC recommends that for children birth to age 2, weight-for-length at or above the 97.7th percentile (+2 z-scores) of the sex specific WHO growth charts be used as a cutoff.5 The American Heart Association recommends that severe obesity in children aged 2 years and older be defined as having a BMI ≥120% of the 95th age and sex specific percentile or an absolute BMI ≥35 kg/m2 , whichever BMI value is lower.6
The measurement and use of BMI and several other indirect measures of FM is described in detail in Section 4.