The dietary recommendations for eating healthy have not changed much in the past few decades—eat more fruits, vegetables, and whole grains and cut back on calories, sugar, and fat. However, it might not be possible for everyone to eat this way even if they tried.
A new study, published in the November issue of the Journal of the Academy of Nutrition and Dietetics, reveals that the food supply contains too much sodium, unhealthy fat, and added sugar and not enough fruits, vegetables, and whole grains for a balanced diet. The findings show that in order to achieve a healthy balance, the fruit supply would need to more than double and the supply of vegetables would need to increase by almost 50 percent. There would also have to be a 40 percent decrease in unhealthy fats and sugar, and more than a 50 percent decrease in sodium.
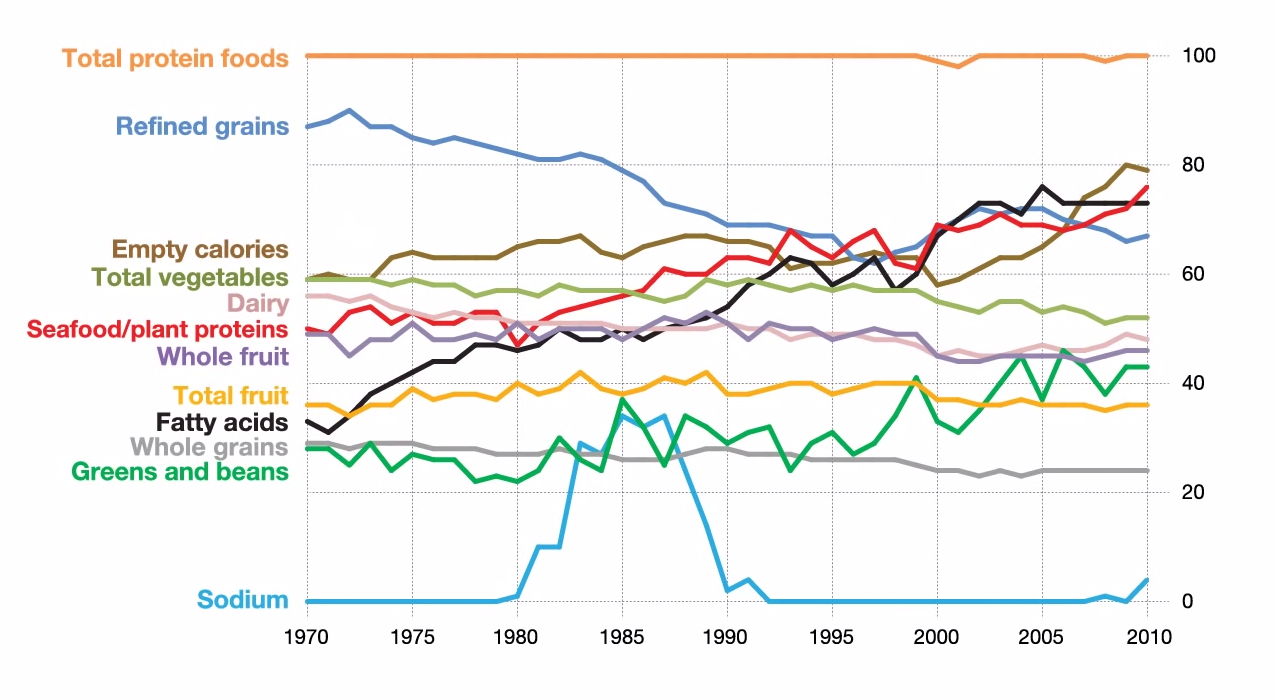
“Our research shows that the healthfulness of the food supply has changed very little in the past 40 years. While the food supply does meet dietary recommendations in some areas, overall it provides too many empty calories and too few fruits, vegetables, and whole grains,” said Susan M. Krebs-Smith, study co-author and chief of the Risk Factor Monitoring and Methods Branch at NCI and member of the National Collaborative on Childhood Obesity Research (NCCOR).
To showcase and disseminate the key findings from this research, the National Cancer Institute (NCI) and NCCOR developed a video, four infographics, and a photo series that draw attention to the deficiencies in the current U.S. food supply to provide a healthy diet. Maximizing outcomes from research by translating and disseminating findings is part of NCCOR’s mission to accelerate progress to reduce childhood obesity in the United States.
Researchers measured the diet quality of the U.S. food supply with a tool called the Healthy Eating Index (HEI). The study, an update of the HEI-2005 research, used the HEI-2010 scoring metric to grade the U.S. food supply in 1970 through 2010.
The HEI tool was developed by researchers at NCI and the U.S. Department of Agriculture. This fact sheet provides further detail about the scoring metric. To see what the HEI scores look like in terms of actual foods at three levels – national, community environment, and individual intake — check out the HEI photo series.
“As the federal government prepares to update the Dietary Guidelines for Americans in 2015, a process they undertake every five years, the HEI scorecard and this suite of materials can inform its work, particularly when considering the national food environment and sustainability,” added NCCOR member Jill Reedy, study co-author and nutritionist with the Risk Factor Monitoring and Methods Branch in ARP at NCI.