
TABLE 1
The 12 HEI-2010 Components
Adequacy
- Total Fruit
- Whole Fruit
- Total Vegetables
- Greens and Beans
- Whole Grains
- Dairy
- Total Protein Foods
- Seafood and Plant Proteins
- Fatty Acids
Moderation
- Refined Grains
- Sodium
- Empty Calories
On this website, you will find examples of how the previous version of the HEI, HEI-2010, was used by researchers to assess and evaluate one aspect of the food environment. Assessing the food supply using the latest version of the index, HEI-2015, has not been done to date, though the process described below would remain the same. If you are looking for more information about the most recent update to the Healthy Eating Index, click here for more about HEI-2015.
Have you ever wondered how your breakfast compares to a breakfast menu that meets national guidelines? Have you ever thought about how healthy the foods in your grocery cart are? Developed by scientists from two of the National Collaborative on Childhood Obesity Research funding partners, the Healthy Eating Index (HEI) is a scoring metric that can help us think through and visualize questions like these. Scroll down to learn about HEI scores and what they look like in terms of actual foods.
The HEI-2010 has 12 components (Table 1), each of which reflects an important aspect of diet quality:
- Nine components focus on adequacy (foods we should eat enough of to get the nutrients we need and for overall good health).
- Three components focus on moderation (dietary components that should be limited or consumed in small amounts).
For each component, the HEI-2010 designates a certain amount as the standard (the best possible).
Example: The standard for Total Fruit is at least 0.8 cup-equivalents1 per 1,000 calories and the standard for Empty Calories is 19 percent or less of total energy.
Depending on the component, amounts that meet the standard get a score of 5, 10, or 20 points. Amounts that do not meet the standard get fewer points, with 0 being the minimum score. Adding up all the components, an ideal overall score is 100.
What Do HEI Scores Mean?
An HEI score can seem abstract, though. The current national food supply has a score of 55. What does that mean in terms of actual foods and beverages? What would our food supply look like if it had an ideal HEI score of 100?
The same question applies to other aspects of the food environment:
- Why might one basket of groceries have a score of 49 and another have a better score of 92?
- What differences in a person’s meal choices over the course of a day would change an HEI score from 93 (high) to 62 (above average) or 48 (below average) or even 27 (low)?
Illustrating HEI Scores with Real Food
To illustrate the reality of different HEI-2010 scores, NCCOR photographed two or more sets of foods2 at several levels of the food stream:
- Amounts of food available per person per day in the national food supply
- The community food environment, represented by $100 worth of groceries for a household
- Three meals and a snack to comprise an individual’s intake on a given day
Scroll down for background information on each set of photos. Click on the links to see the photos and key messages about them. Click on the links under “Tables with Food Lists and Corresponding HEI Scores” at the bottom of this page to see tables that list the items in the photos and their HEI scores. Each set of photos also has a link to its companion table.
Also, review the photo series’ complementary White Paper.
Note: The foods and beverages in the photos below are examples of items that could be combined to produce HEI scores at various levels. Not all differences in the foods and beverages included in each set of photos affect the scores. The differences that do substantially affect the scores are noted in the key messages.
 NATIONAL FOOD SUPPLY
 NATIONAL FOOD SUPPLY
What is the Food Supply?
The food supply is the total amount of foods and beverages available for consumption in America. It includes foods and beverages produced in this country as well as those imported from other countries.
One way to quantify the food supply is in terms of the many tons of food available to the nation as a whole. Another, and simpler, way is to think about the food supply in terms the amounts of foods and beverages available to each person each day. The National Cancer Institute (NCI, an NCCOR funding partner) followed this approach, using data from the U.S. Department of Agriculture (USDA, an NCCOR funding partner).
Constructing the Photos: Step 1—Make Lists of Foods
NCI compiled a list of the types and amounts of foods and beverages currently available per person in the U.S. food supply.3 These foods and beverages were organized by HEI component. This list has an HEI score of 55.
NCI then modified the amounts in each component to represent an “improved” list that aligns with standards for maximum HEI scores. This list has an HEI score of 100.
Constructing the Photos: Step 2—Choose the Foods
To create the “current” and “improved” national food supply photos, NCI selected common foods to represent entire categories from the lists.
Example: Fruit was represented by apples, bananas, and melons because they are the leading fruits, by weight, in the food supply. The foods in the picture are shown as raw or in a relatively unprocessed state to indicate that they are basic agricultural commodities.
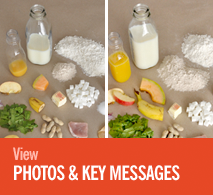
The amounts of foods shown in each category were based, in the first photo, on the amounts currently available per person per day in the U.S. food supply. In the second photo, they were based on an altered food supply that would lead to an improved score.
Examples: The total amount of fruit shown in the “current” photo is 0.5 cup-equivalents because that is the amount currently available for each person in the U.S. food supply.
In the “improved” photo, the total amount is 0.9 cup-equivalents (roughly double the amount in the “current” photo), because that is the per capita amount the food supply would need to produce if it were to provide all Americans with sufficient fruit to meet federal dietary guidelines.
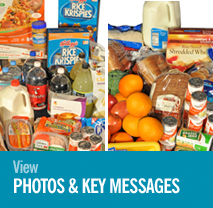
COMMUNITY FOOD ENVIRONMENT
What is the Community Food Environment?
The community food environment represents all the places where people acquire or consume foods and beverages, including grocery stores, restaurants, schools, and at home.
Constructing the Photos: Step 1—Make Lists of Foods
NCI created “typical” and “improved” lists of $100 worth of groceries that could be purchased for a household.
The amounts in the “typical” list were derived from a USDA study that examined current spending on groceries by U.S. consumers nationwide.4
Example: The study found that 1.33 percent of spending went toward “eggs and egg mixtures.” Coming as close to that percentage as possible, the “typical” list includes eight eggs, which cost $1.29, or 1.29 percent of $100. The groceries in the “typical” photo reflect foods in the HEI components that Americans may commonly buy. These groceries have an HEI score of 49.
The USDA study also included recommended shares of expenditures for each component to result in a basket with improved diet quality. The recommended shares were based on USDA’s food plans, which meet federal dietary guidelines. NCI used these recommended shares of expenditures to develop the “improved” food list.
Example: The recommended share of expenditures on lower fat and fat-free milk and low-fat yogurt was 8.77 percent. Coming as close to that percentage as possible, the “improved” list includes fat-free milk and low-fat yogurt that cost $8.99, or 8.99 percent of $100. These groceries have an HEI score of 92.
Constructing the Photos: Step 2—Choose the Foods
The “typical” and “improved” lists represent two of many possible “market baskets” that could be purchased for $100.
It is recognized that the decisions households make about items to purchase are influenced by many considerations, such as time available for food preparation (dry beans take longer to prepare than ready-to-eat canned beans) and cost (frozen vegetables may cost less than fresh vegetables).
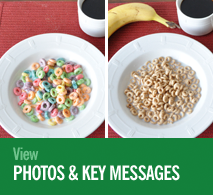
INDIVIDUAL INTAKE
 INDIVIDUAL INTAKE
What is Individual Intake?
Individual intake is all the foods and beverages a person consumes in meals and snacks, in this case, over the course of a day.
Constructing the Photos: Step 1—Make Lists of Foods
NCI created four sample daily menus for breakfast, lunch, dinner, and a snack. Each individual intake is about 2,000 calories. The “high” menu, with an HEI score of 93, is based on meals constructed by USDA to demonstrate how to meet Dietary Guidelines for Americans.5
Based on that menu, NCI then created three additional menus with changes that reduced their HEI score. The three additional menus were “above average”6 (HEI=62), “below average” (HEI=48), and “low” (HEI=27).
Constructing the Photos: Step 2—Choose the Foods
Each of the four menus consists of commonly available foods typically consumed by Americans.
Tables with Food Lists & Corresponding HEI Scores
 Tables with Food Lists & Corresponding HEI Scores
National Food Supply
Foods and HEI-2010 Scores for the National Food Supply
| Current | Improved | |
|---|---|---|
| Apple, raw | 0.25 cup (4 Tb) | 0.44 cup (7 Tb) |
| Banana, raw | 0.13 cup (2.1 Tb) | 0.23 cup (3.7 Tb) |
| Melon, raw | 0.13 cup (2.1 Tb) | 0.23 cup (3.7 Tb) |
| Orange juice | 0.28 cup (4.5 Tb) | 0.90 cup (14.4 Tb) |
| Romaine, dark leaves | 0.22 cup (3.5 Tb) | 0.30 cup (4.8 Tb) |
| Broccoli | 0.11 cup (1.8 Tb) | 0.15 cup (2.4 Tb) |
| Kidney beans, canned | 0.12 cup (1.9 Tb) | 0.15 cup (2.4 Tb) |
| Potato | 0.50 cup (8 Tb) | 0.75 cup (12 Tb) |
| Tomato | 0.44 cup (7 Tb) | 0.63 cup (10 Tb) |
| Corn | 0.13 cup (2 Tb) | 0.19 cup (3 Tb) |
| Onion | 0.13 cup (2 Tb) | 0.19 cup (3 Tb) |
| Lettuce | 0.13 cup (2 Tb) | 0.19 cup (3 Tb) |
| Carrot | 0.06 cup (1 Tb) | 0.09 cup (1.5 Tb) |
| Beef | 2.0 oz | 1.5 oz |
| Pork | 1.2 oz | 0.8 oz |
| Chicken | 2.0 oz | 1.5 oz |
| Tuna, canned, drained | 0.5 oz | 0.8 oz |
| Whole grain flour | 0.23 cup (3.7 Tb) | 0.80 cup (12.7 Tb) |
| White flour | 1.60 cup (26.0 Tb) | 0.90 cup (14.5 Tb) |
| Fluid milk (fat-free) | 1.70 cup | 2.90 cup |
| Peanut butter | 0.75 Tb (0.05 cup) | 1 Tb (0.06 cup) |
| Salt | 2.3 tsp | 1.1 tsp |
| Sugar | 29 tsp | 17 tsp |
| Butter | 2.3 Tb | 1.5 Tb |
| Alcohol | 1.5 oz distilled 86 proof | 1.5 oz distilled 86 proof |
Component and Total HEI Scores
| Component (Maximum Score) | Current | Improved |
|---|---|---|
| Adequacy | ||
| Total Fruit (5) | 2 | 5 |
| Whole Fruit (5) | 2 | 5 |
| Total Vegetables (5) | 3 | 5 |
| Greens/Beans (5) | 2 | 5 |
| Whole Grains (10) | 2 | 10 |
| Dairy (10) | 5 | 10 |
| Total Protein Foods (5) | 5 | 5 |
| Seafood and Plant Proteins (5) | 4 | 5 |
| Fatty Acids (10) | 7 | 10 |
| Moderation | ||
| Refined Grains (10) | 7 | 10 |
| Sodium (10) | 0 | 10 |
| Empty Calories (20) | 16 | 20 |
| TOTAL SCORE (100) | 55 | 100 |
Community Food Environment
Foods and HEI-2010 Scores for the Community Food Environment Baskets1
| Typical | Improved |
|---|---|
| Basket contents | |
| 59 oz. premium orange juice, no pulp | 12 oz. frozen orange juice concentrate |
| 1 apple | 7 apples |
| 1 orange | 7 oranges |
| 4 bananas | 7 bananas |
| 5 baking potatoes | 4 baking potatoes |
| 4 1-lb bags frozen mixed vegetables | 1 lb kale |
| 1/2 lb mushrooms | |
| 21 oz broccoli | |
| 1 head cauliflower | |
| 1 lb baby carrots | |
| 1 whole acorn squash | |
| 4 tomatoes | |
| 1 lb bag kidney beans | |
| 1 lb bag chickpeas | |
| 1 lb bag black beans | |
| 1 lb bag navy beans | |
| 1 lb bag lentils | |
| 1 lb ground beef 9 oz deli sliced ham |
1 lb ground beef |
| 9 oz deli sliced turkey breast | 1 lb ground chicken |
| 8 eggs | |
| 5 oz canned tuna | 12 oz canned tuna 1 lb tilapia fillets |
| 1 gal whole milk | 1 gal fat-free milk |
| 8 6-oz fat-free vanilla yogurt | 10 6-oz fat-free vanilla yogurt |
| 2 8-oz cheddar cheese | |
| 1-lb loaf whole wheat bread | 3 1-lb loaves whole wheat bread |
| 1 22-oz load white bread | 8-ct package hamburger buns |
| 4-ct cranberry muffins | |
| 2 18-oz boxes refined crisped rice breakfast cereal | 1 lb shredded wheat cereal |
| 32-oz pancake & waffle mix | 1 1/2 lb quick oats |
| 1 lb fettuccini | |
| 2 lb white rice | |
Component and Total HEI Scores
| Component (Maximum Score) | Typical | Improved |
|---|---|---|
| Adequacy | ||
| Total Fruit (5) | 2 | 4 |
| Whole Fruit (5) | 2 | 5 |
| Total Vegetables (5) | 4 | 5 |
| Greens/Beans (5) | 0 | 5 |
| Whole Grains (10) | 4 | 10 |
| Dairy (10) | 7 | 4 |
| Total Protein Foods (5) | 4 | 5 |
| Seafood and Plant Proteins (5) | 5 | 5 |
| Fatty Acids (10) | 3 | 10 |
| Moderation | ||
| Refined Grains (10) | 4 | 10 |
| Sodium (10) | 3 | 9 |
| Empty Calories (20) | 12 | 20 |
| TOTAL SCORE (100) | 49 | 92 |
Citations
- Trade names, commercial products, or companies featured in the photographs and accompanying text on these web pages are included solely for illustrative purposes and do not imply recommendation, endorsement, or criticism by NCCOR or its funding partners.
Individual Intake
Foods and HEI-2010 Scores for Individual-Level Menus1
| HIGH | ABOVE AVERAGE | BELOW AVERAGE | LOW | |
|---|---|---|---|---|
| Breakfast | ||||
| 1 cup Cheerios cereal 4 oz fat-free milk |
1 cup Corn Flakes cereal 4 oz fat-free milk |
1 cup Cinnamon Toast Crunch cereal 4 oz 2% milk |
1 cup Froot Loops cereal 4 oz 2% milk |
|
| 1 banana, fresh | ||||
| 1 slice whole wheat toast 1 tsp soft margarine 2 tbsp jam |
1 slice white toast 1 tsp soft margarine 2 tbsp jam |
1 slice white toast 1 tsp butter 2 tbsp jam |
||
| 8 oz orange juice | 12 oz orange juice | 4 oz orange juice | ||
| 8 oz coffee (regular) | 8 oz coffee (regular) | 8 oz coffee (regular) | 8 oz coffee (regular) 2 tsp sugar 1 oz half and half |
|
| Lunch | ||||
| Tuna sandwich on rye bread (with lettuce, celery, and mayonnaise) | Ham sandwich on white bread (with lettuce, tomatoes, and mayonnaise) | Ham sandwich on white bread (with lettuce, tomatoes, and mayonnaise) | Grilled ham and cheese sandwich on white bread (grilled with butter) | |
| 1 pear | 1 single serving bag, potato chips | 1 single serving bag, potato chips | ||
| 8 oz fat-free milk | 8 oz fat-free milk | 8 oz 2% milk | 1 can regular soda | |
| Dinner | ||||
| 1 baked skinless chicken breast | 1 baked skinless chicken breast | 1 baked chicken breast with skin | 1 fried chicken breast | |
| 1 large baked sweet potato | 1 large baked sweet potato | 1 small baked sweet potato | ½ cup macaroni and cheese | |
| ½ cup steamed broccoli 1 tsp soft margarine |
½ cup steamed corn 1 tsp soft margarine |
½ cup steamed corn 1 tsp butter |
½ cup steamed corn 1 tsp butter |
|
| 1 whole wheat roll 1 tsp soft margarine |
1 white roll 1 tsp soft margarine |
|||
| 8 oz water | 8 oz water | 8 oz water | 8 oz water | |
| Snack | ||||
| 6 oz low-fat vanilla yogurt | 6 oz low-fat vanilla yogurt | 3 medium chocolate chip cookies | 1 cake doughnut | |
| ½ cup cherries | 10 oz mixed berry fruit juice | 4 oz 2% milk | 8 oz coffee (regular) 2 tsp sugar 1 oz half and half |
|
Component and Total HEI Scores
| Component (Maximum Score) | High | Above Average | Below Average | Low |
|---|---|---|---|---|
| Adequacy | ||||
| Total Fruit (5) | 5 | 5 | 1 | 0 |
| Whole Fruit (5) | 5 | 0 | 0 | 0 |
| Total Vegetables (5) | 5 | 5 | 4 | 2 |
| Greens/Beans (5) | 5 | 0 | 0 | 0 |
| Whole Grains (10) | 10 | 0 | 1 | 0 |
| Dairy (10) | 9 | 8 | 7 | 4 |
| Total Protein Foods (5) | 5 | 5 | 5 | 5 |
| Seafood and Plant Proteins (5) | 5 | 0 | 0 | 0 |
| Fatty Acids (10) | 10 | 10 | 5 | 1 |
| Moderation | ||||
| Refined Grains (10) | 10 | 5 | 5 | 4 |
| Sodium (10) | 4 | 4 | 7 | 5 |
| Empty Calories (20) | 20 | 20 | 13 | 5 |
| TOTAL SCORE (100) | 93 | 62 | 48 | 27 |
Citations
- Trade names, commercial products, or companies featured in the photographs and accompanying text on these web pages are included solely for illustrative purposes and do not imply recommendation, endorsement, or criticism by NCCOR or its funding partners.
CITATIONS
- Food guidance is given in terms of cup- and ounce-equivalents. These equivalents represent a quantity of food that is nutritionally equivalent to a cup of milk or a cup of most types of fruits and vegetables, or to an ounce of grains or to an ounce of meat, fish or poultry. For example, 1 cup-equivalent of fruit is: 1 cup raw or cooked fruit, ½ cup dried fruit, or 1 cup fruit juice. Back to section
- Trade names, commercial products, or companies featured in the photographs and accompanying text on these web pages are included solely for illustrative purposes and do not imply recommendation, endorsement, or criticism by NCCOR or its funding partners. Back to section
- Economic Research Service, USDA. Food Availability (Per Capita) Data System. http://www.ers.usda.gov/data-products/food-availability-(per-capita)-data-system.aspx Back to section
- Volpe R, Okrent A. Assessing the healthfulness of consumers’ grocery purchases. EIB-102. Washington (DC): USDA, ERS, November 2012. http://www.ers.usda.gov/media/945051/eib102.pdf Back to section
- USDA, CNPP. Sample meal patterns for the USDA Food Pattern at the 2,000 calorie level.http://www.choosemyplate.gov/food-groups/downloads/Sample_Menus-2000Cals-DG2010.pdf Back to section
- The term “average” here refers to the national median, which is a score of 53.5. Back to section