
Featured
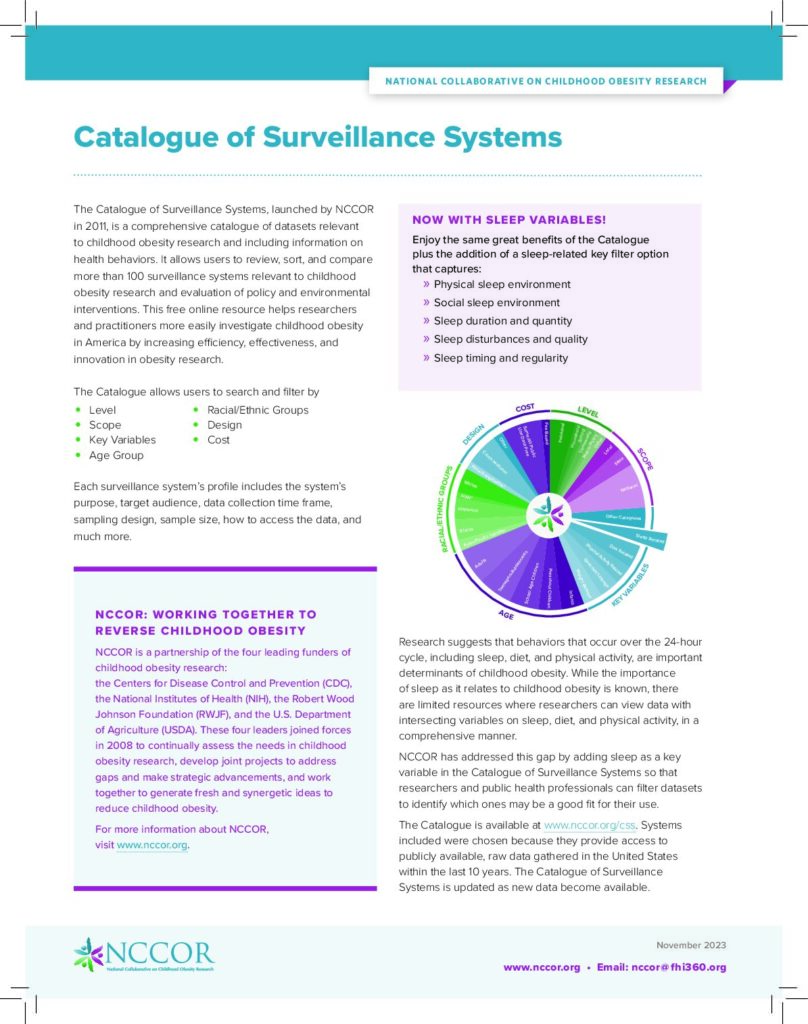
Our updated factsheet explains why sleep was added to the CSS and how the new variables can expand and deepen your research.
2023 |
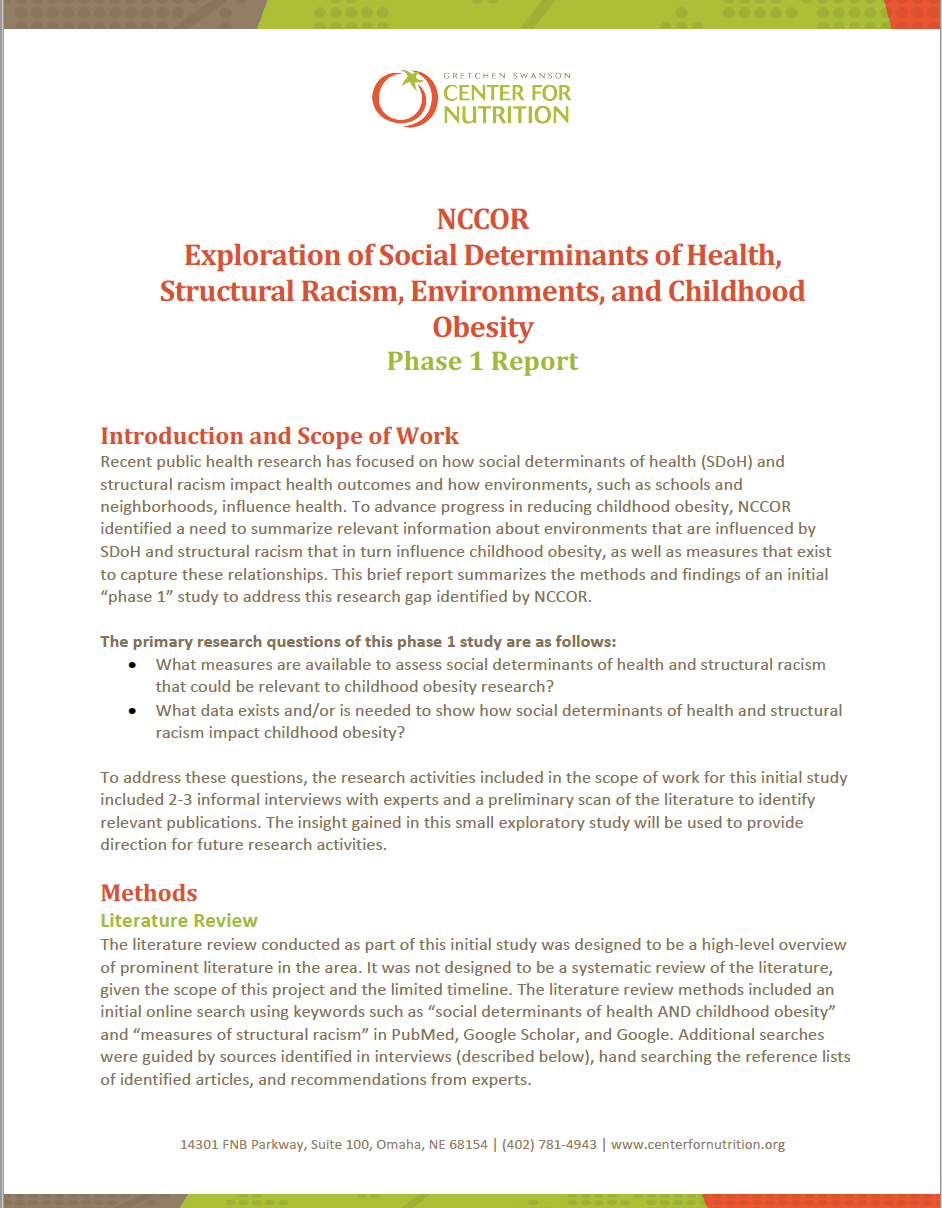
Vest D, Anderson Steeves E, Berrigan D, Sharfman A, Nelson K, Yaroch AL. The influence of social determinants of health and structural racism on childhood obesity. Child Obes. 2023 Nov 1. doi: 10.1089/chi.2023.0101. Epub ahead of print. PMID: 37910862.
2023 | Dietary Assessment
Zimmer M, Obbagy J, Scanlon KS, Gibbs K, Lerman JL, Hamner HC, Pannucci T, Sharfman A, Reedy J, Herrick KA, Count Every Bite to Make “Every Bite Count”: Measurement Gaps and Future Directions for Assessing Diet from Birth to 24 Months, Journal of the Academy of Nutrition and Dietetics (2023), doi: https://doi.org/10.1016/j.jand.2023.05.011.


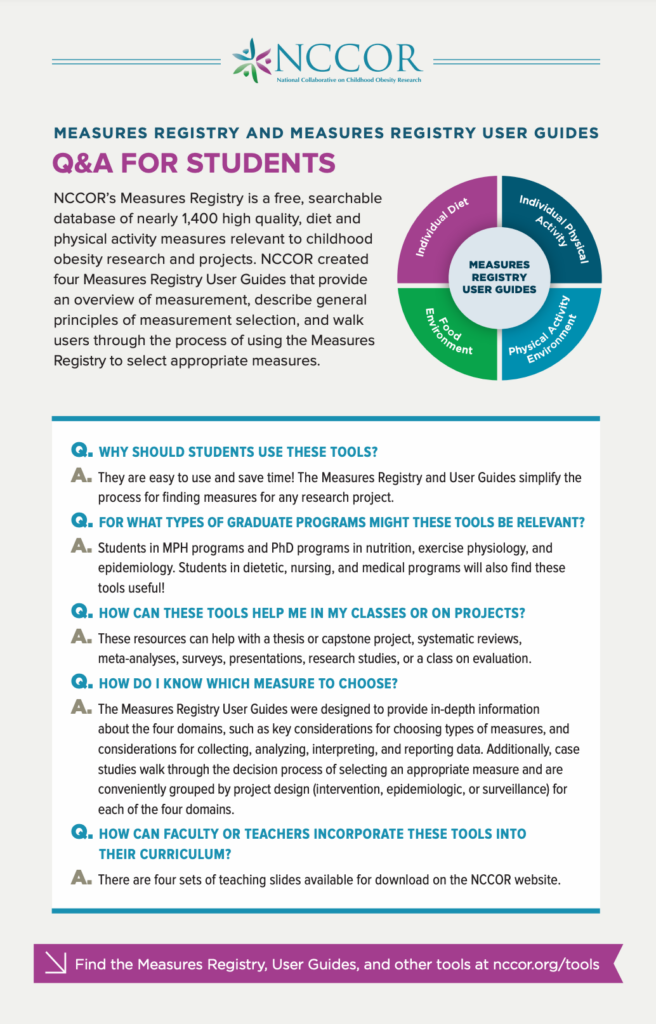
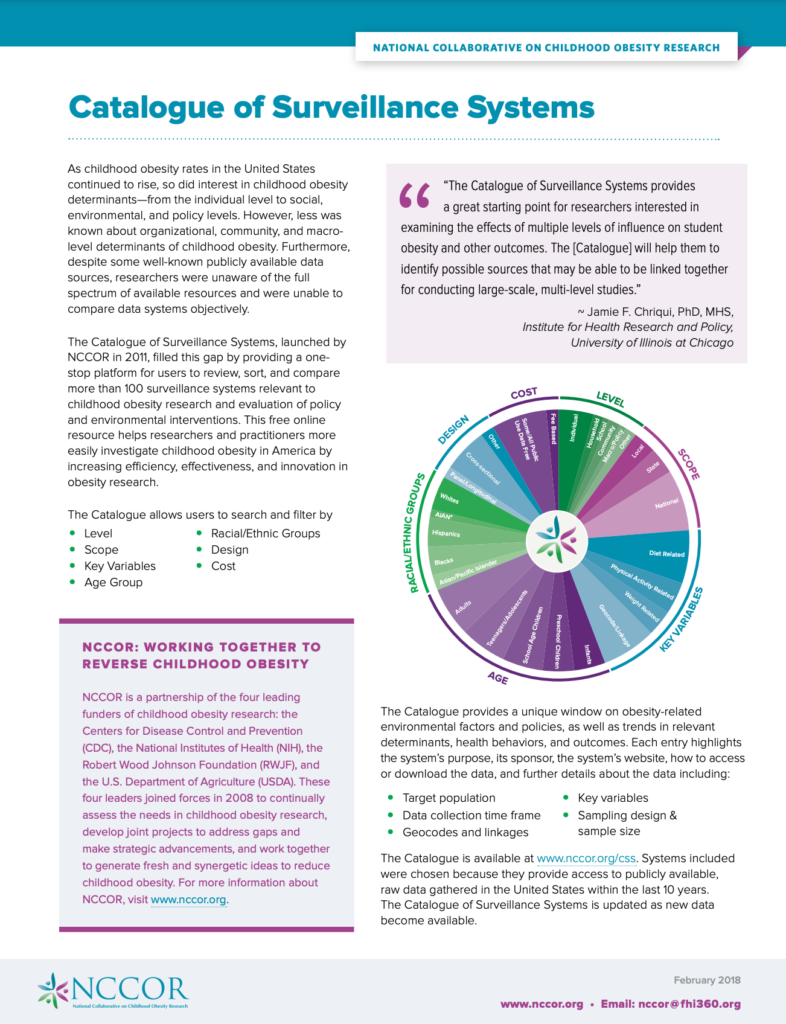
2023 | Measures Registry and Catalogue of Surveillance Systems
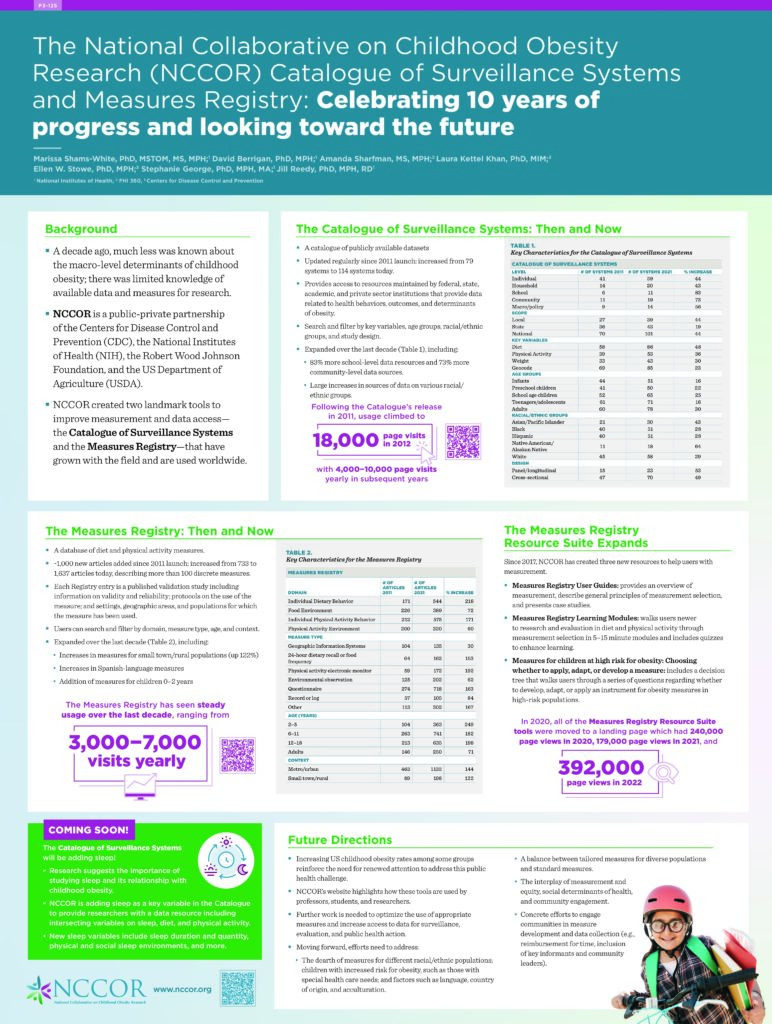
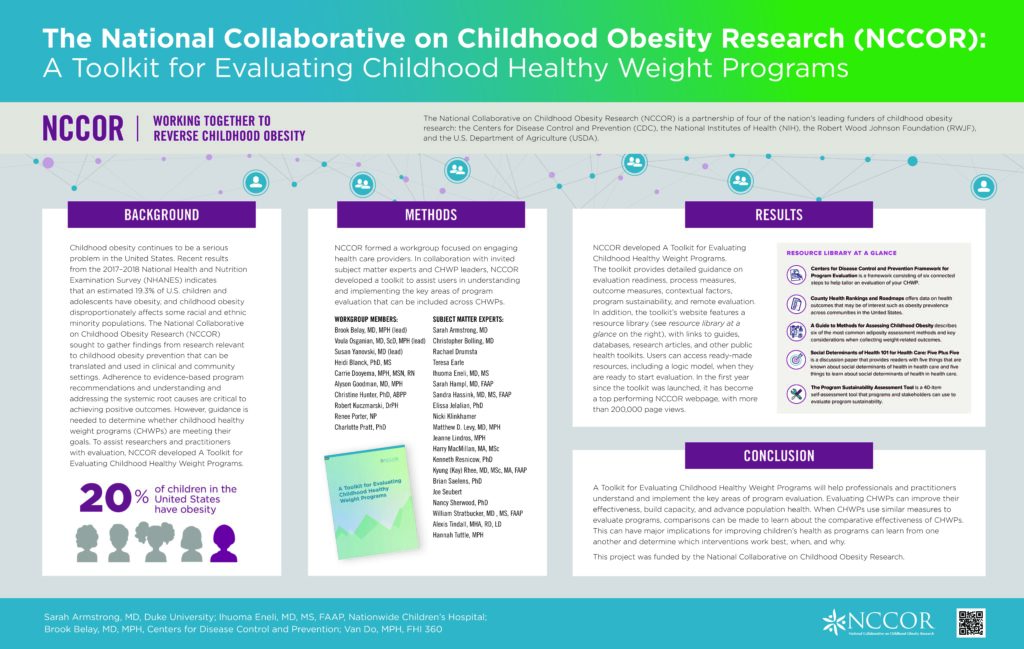
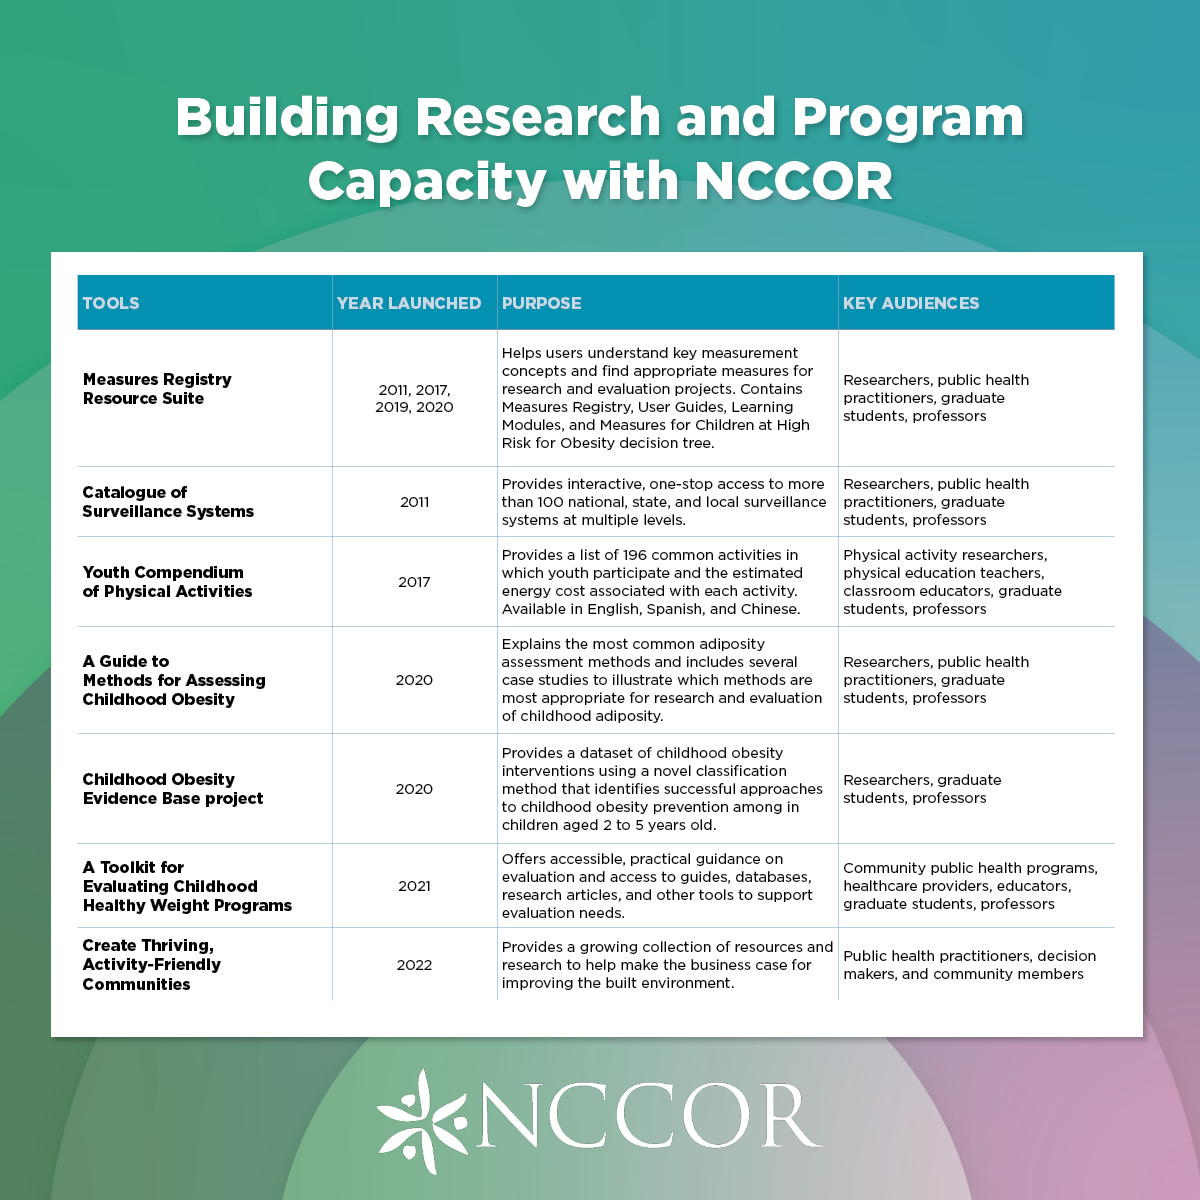
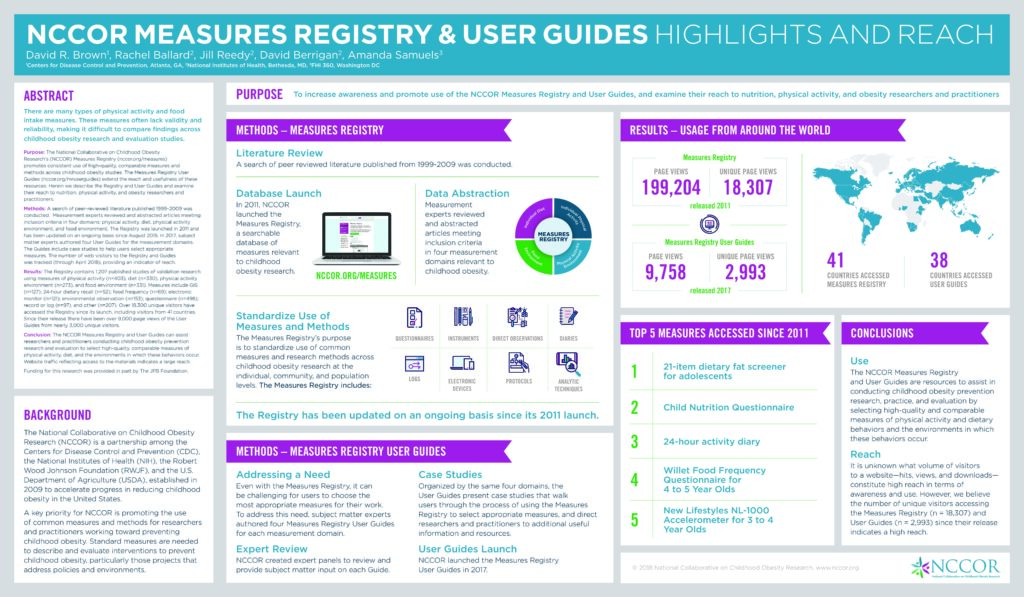
Sharfman AS, Berrigan D, Galuska DA et al. National Collaborative on Childhood Obesity Research Efforts to Advance Childhood Obesity Research: Progress and Next Steps. Am J Prev Med. 2023. https://doi.org/10.1016/j.amepre.2023.02.017
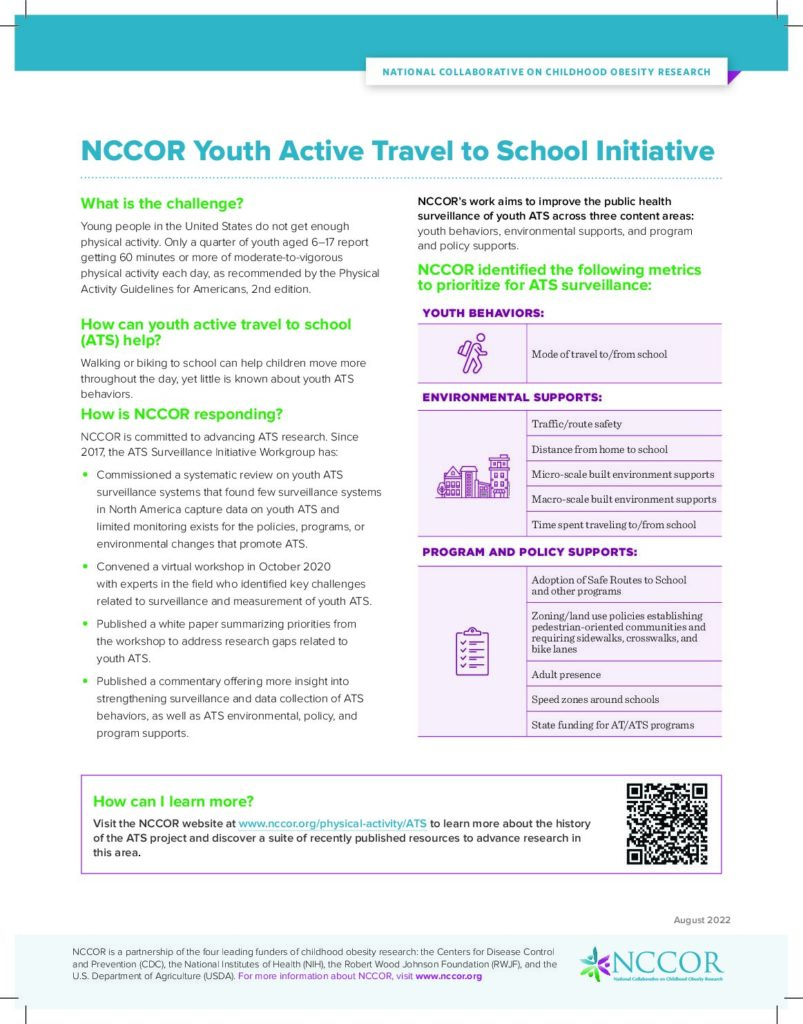

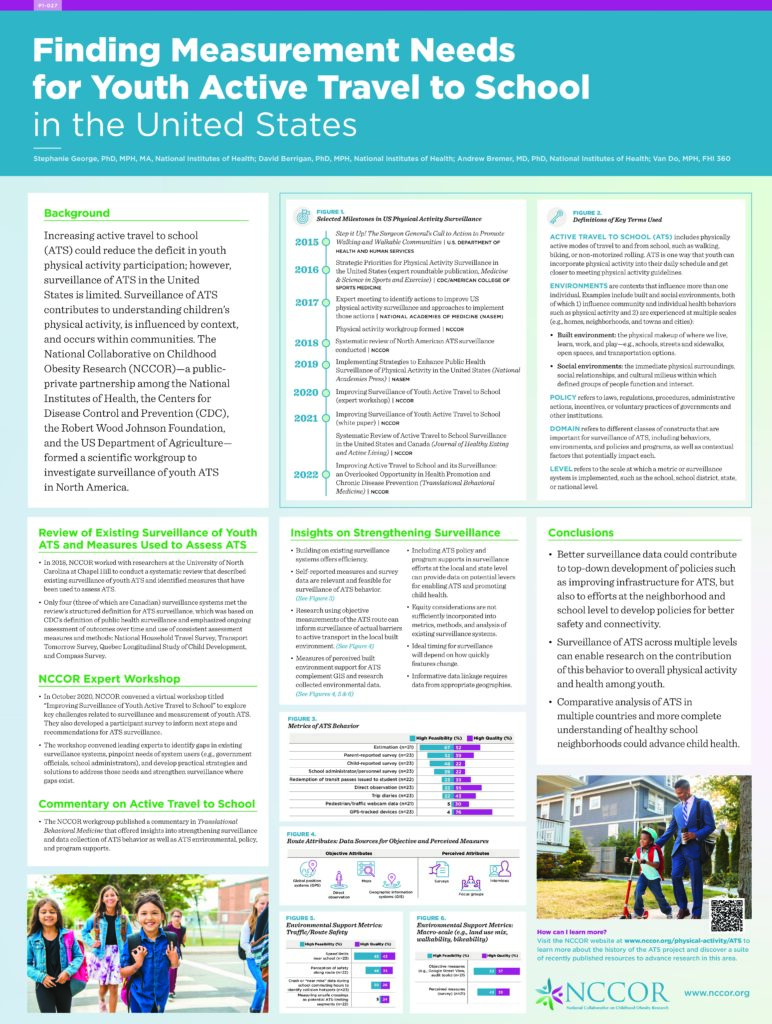
2022 | Youth Active Travel to School (ATS) Surveillance Initiative
George SM, Sliwa SA, Cornett KA, et al. Improving Active Travel to School and Its Surveillance: An Overlooked Opportunity in Health Promotion and Chronic Disease Prevention. Translational Behavioral Medicine, 2022. https://doi.org/10.1093/tbm/ibac023
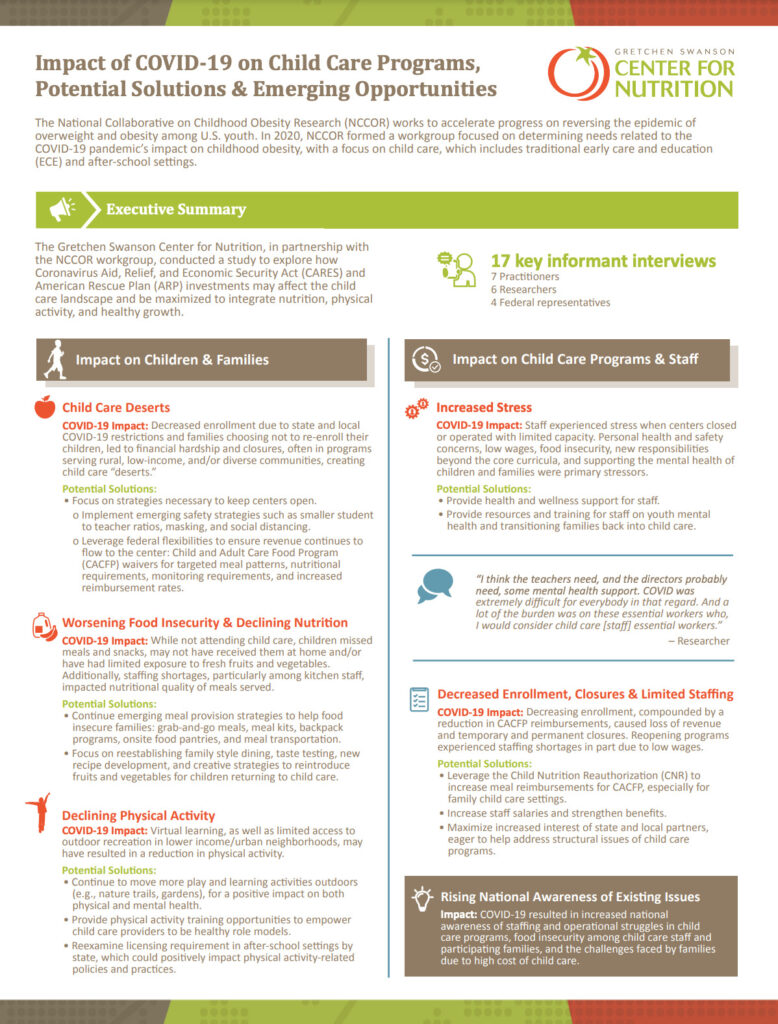
2022 | Impact of COVID-19 on Child Care Programs, Potential Solutions & Emerging Opportunities
Nitto A, Berrigan D, Bremer A, et al. Key Informant Interviews to Inform Nutrition and Physical Activity Recovery Efforts in Child Care Settings amid the COVID-19 Pandemic in the United States. Frontiers in Public Health. June 2022. https://doi.org/10.3389/fpubh.2022.888368

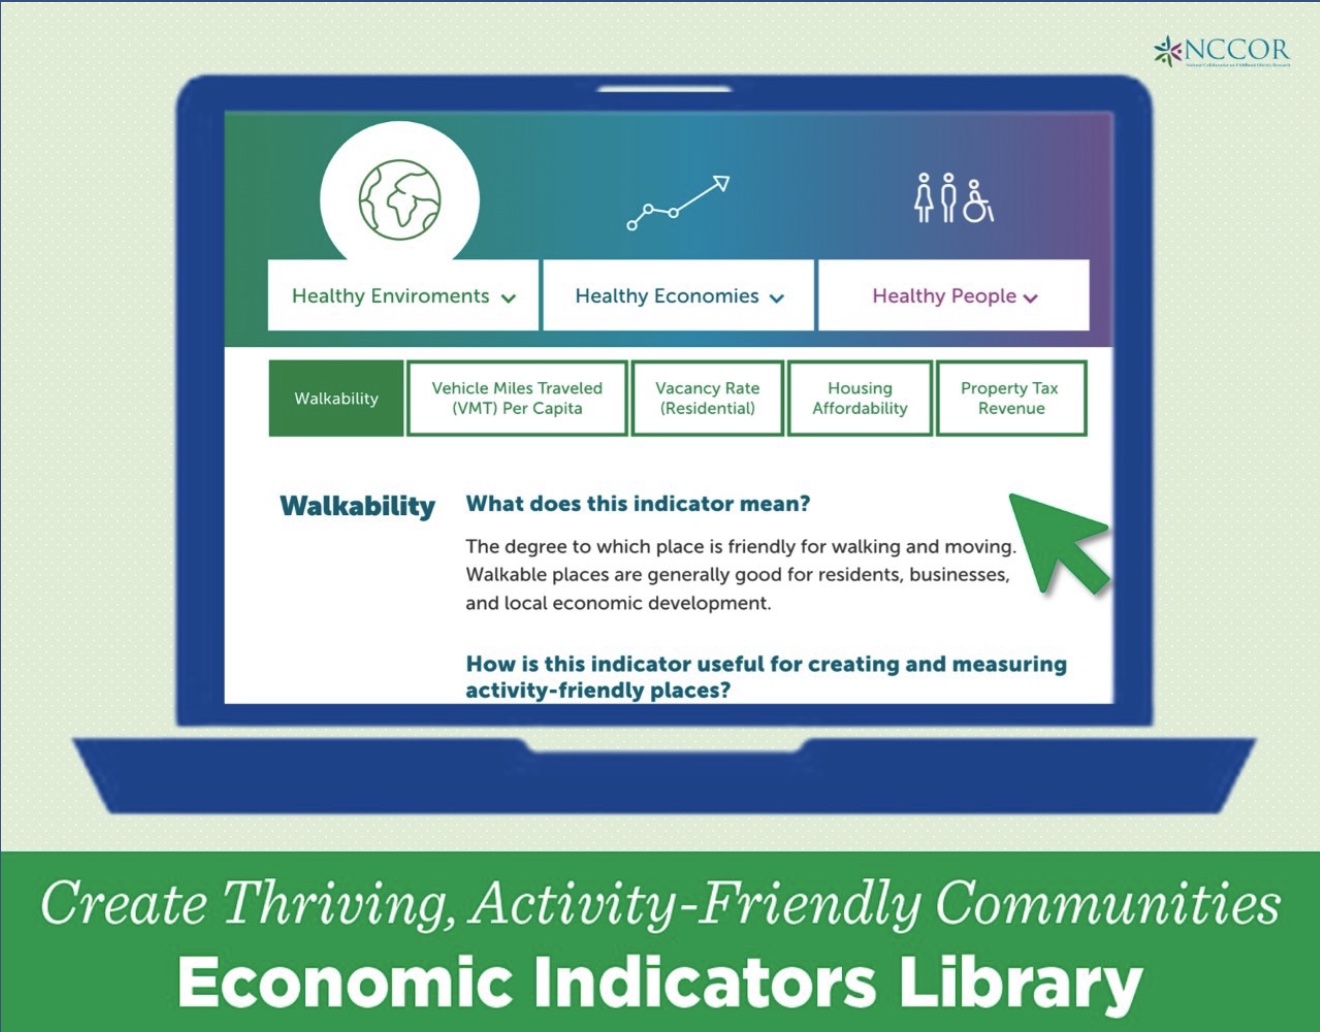
2022 | Additional Benefits of Walkability
Pollack Porter, K, Omura, J, Ballard R, et al. Systematic Review on Quantifying Pedestrian Injury When Evaluating Changes to the Built Environment. Prev. Med. Rep. 2022. https://doi.org/10.1016/j.pmedr.2022.101703
2021 | NCCOR Projects
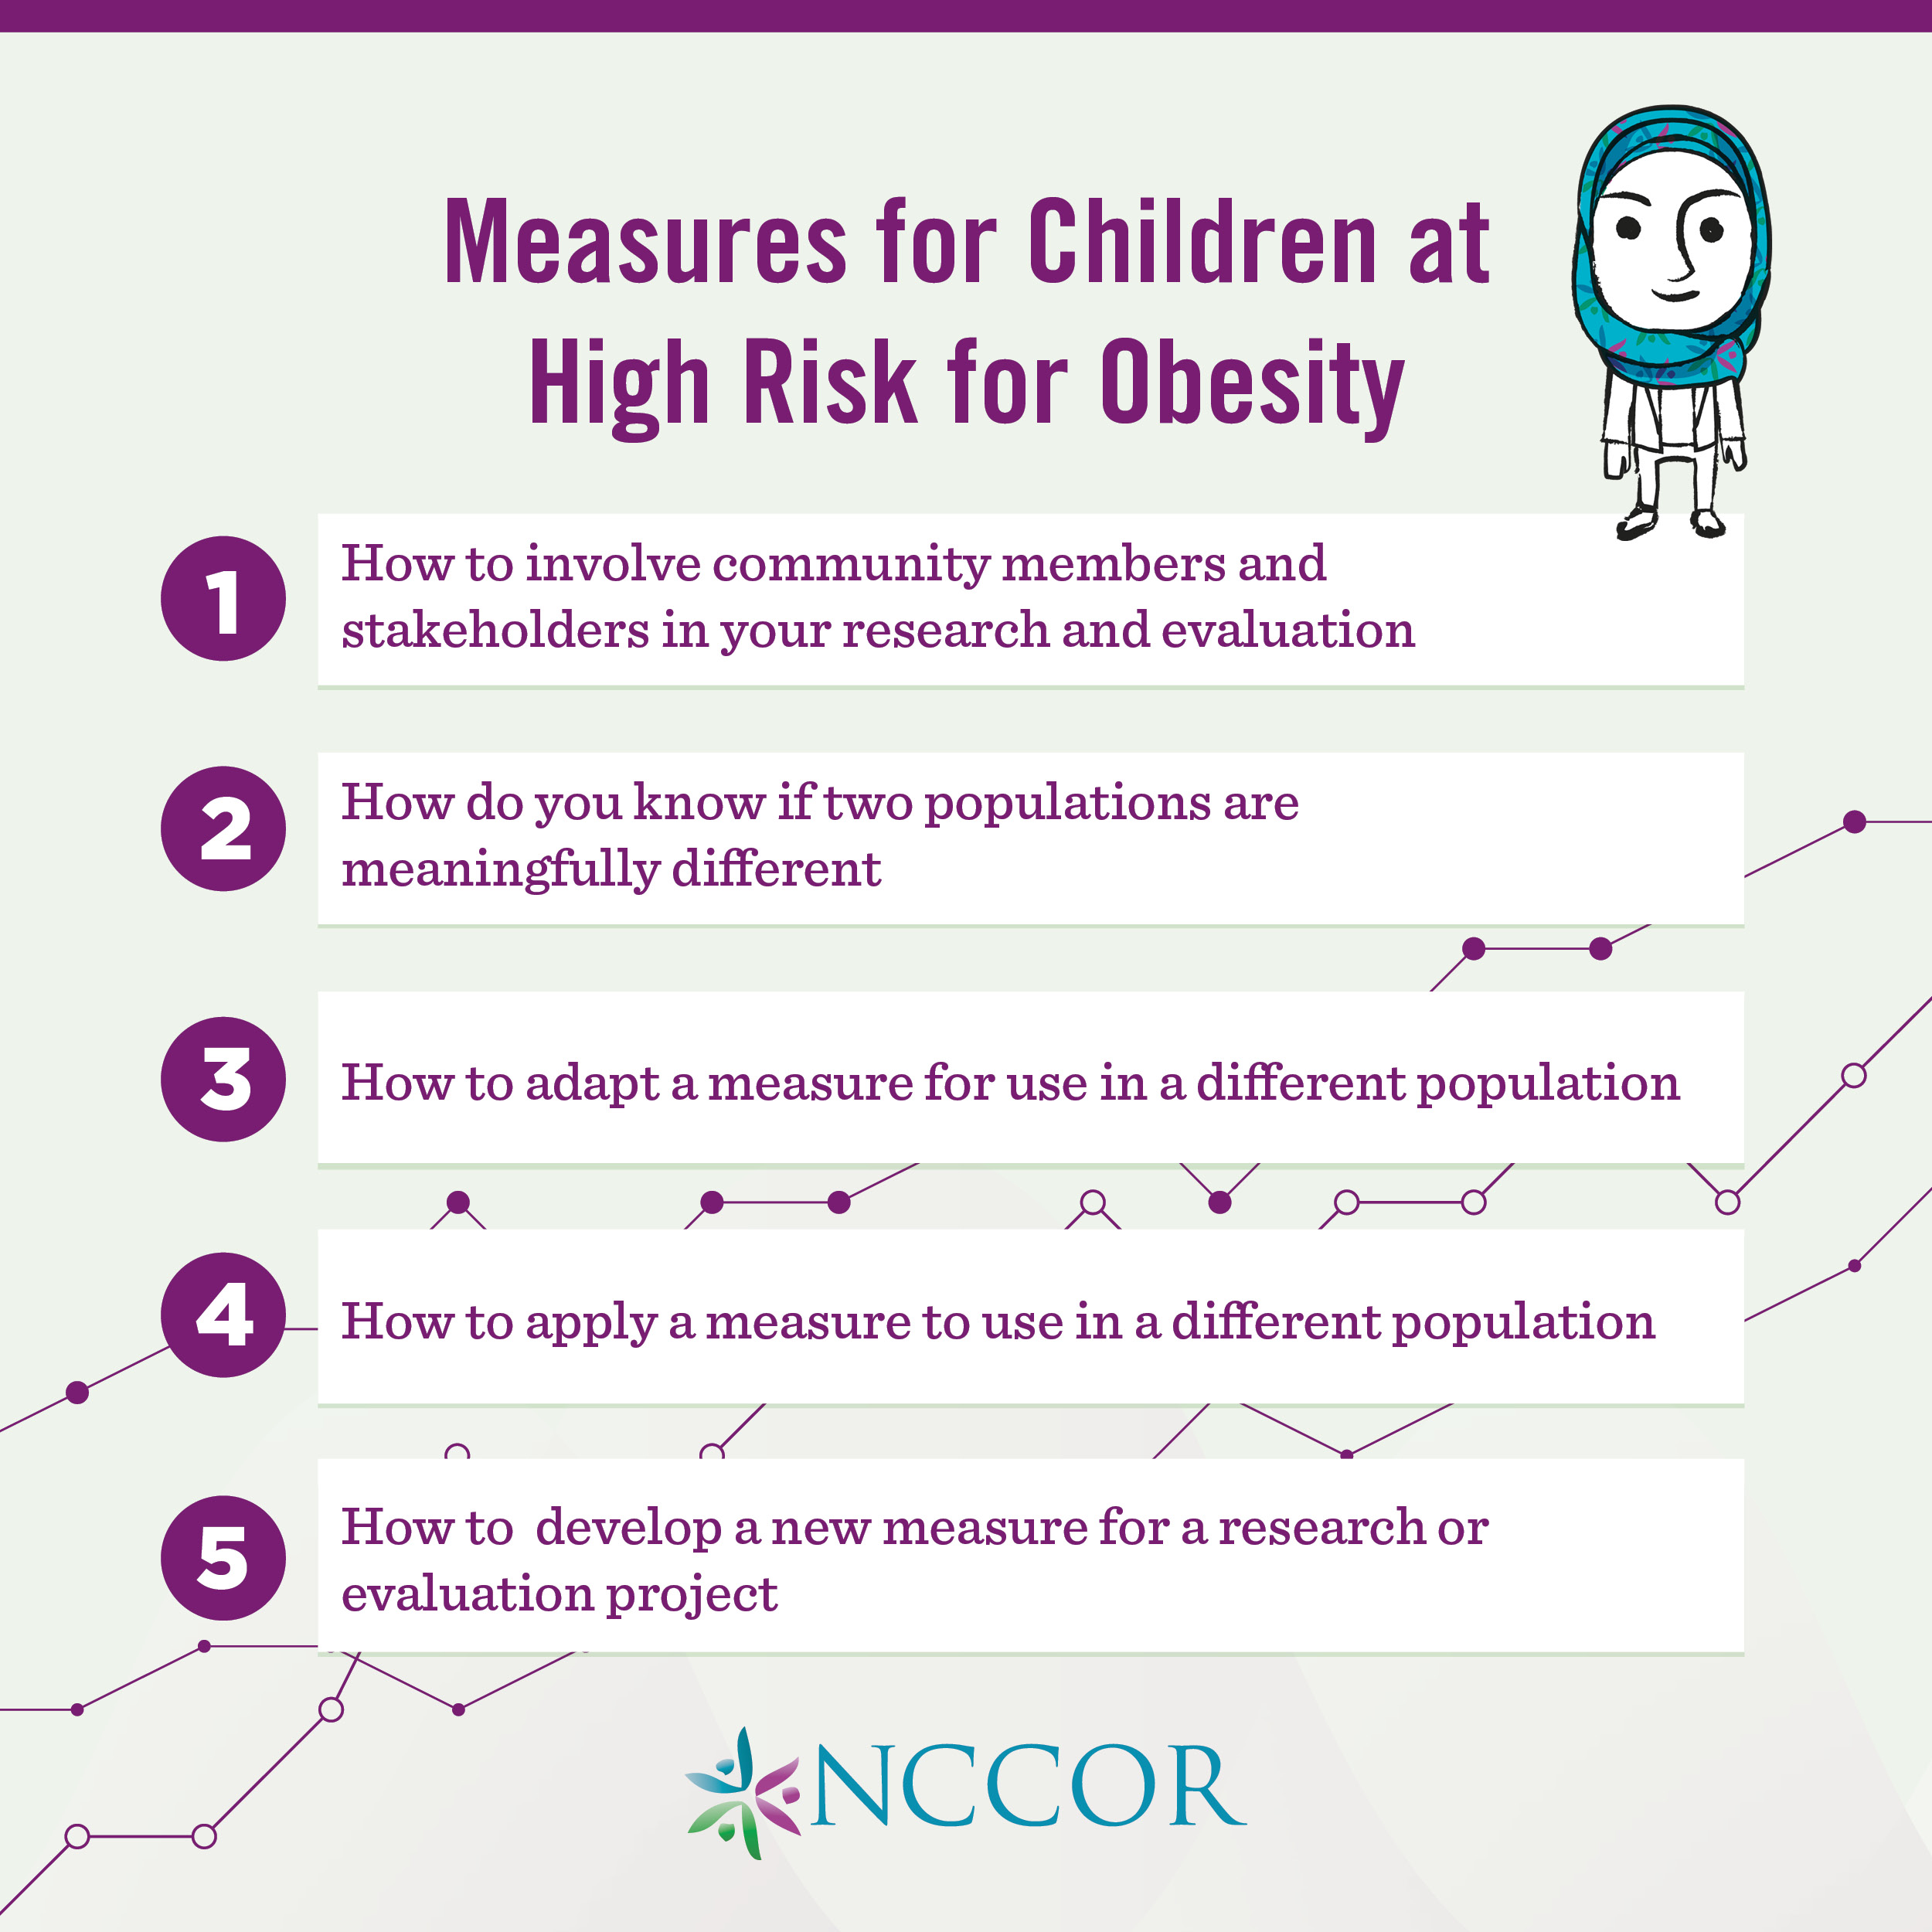
Ballard, R, Arteaga, SS, Berrigan, D, et al. Advancing Measurement to Address Childhood Obesity: Results of 3 Workshops. Am J Prev Med. 2021. https://doi.org/10.1016/j.amepre.2021.05.025
2021 | Youth Active Travel to School (ATS) Surveillance Initiative
Wolfe, MK, McDonald, NC, Ussery, EN, George, SM, & Watson, KB. Systematic Review of Active Travel to School Surveillance in the United States and Canada. Journal of Healthy Eating and Active Living, 2021;1(3), 127–141. https://doi.org/10.51250/jheal.v1i3.24
2021 | Economic Impact of Built Environment Improvements
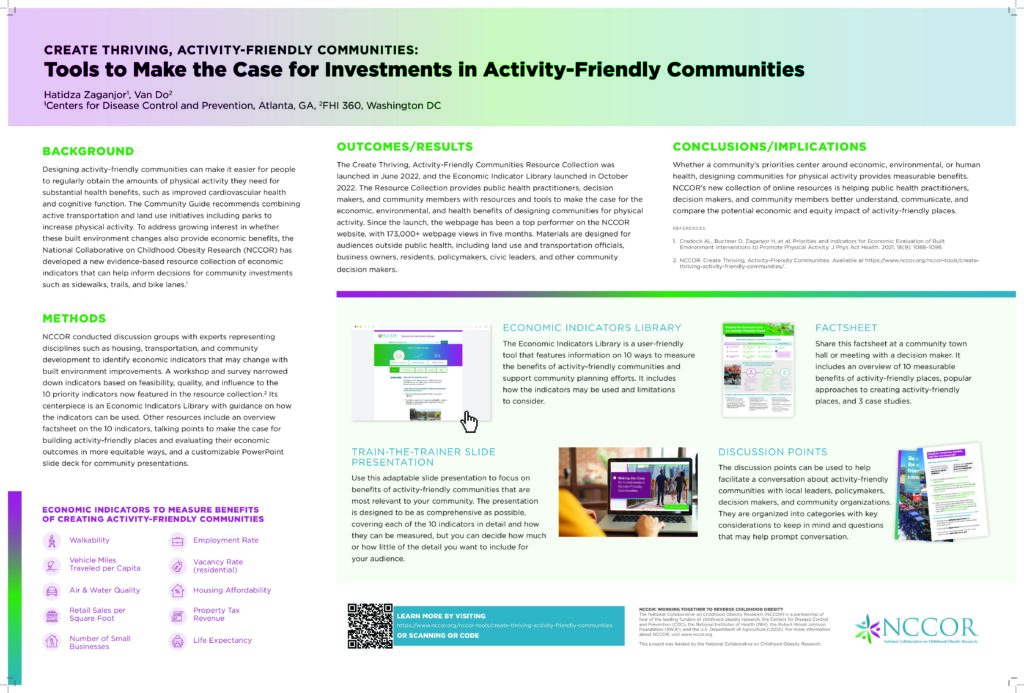
Cradock AL, Buchner D, Zaganjor H, et al. Priorities and Indicators for Economic Evaluation of Built Environment Interventions to Promote Physical Activity. J Phys Act Health. Available at https://doi.org/10.1123/jpah.2021-0191


2020 | Increasing Opportunities for Trail Use to Promote Physical Activity and Health Among Underserved Youth
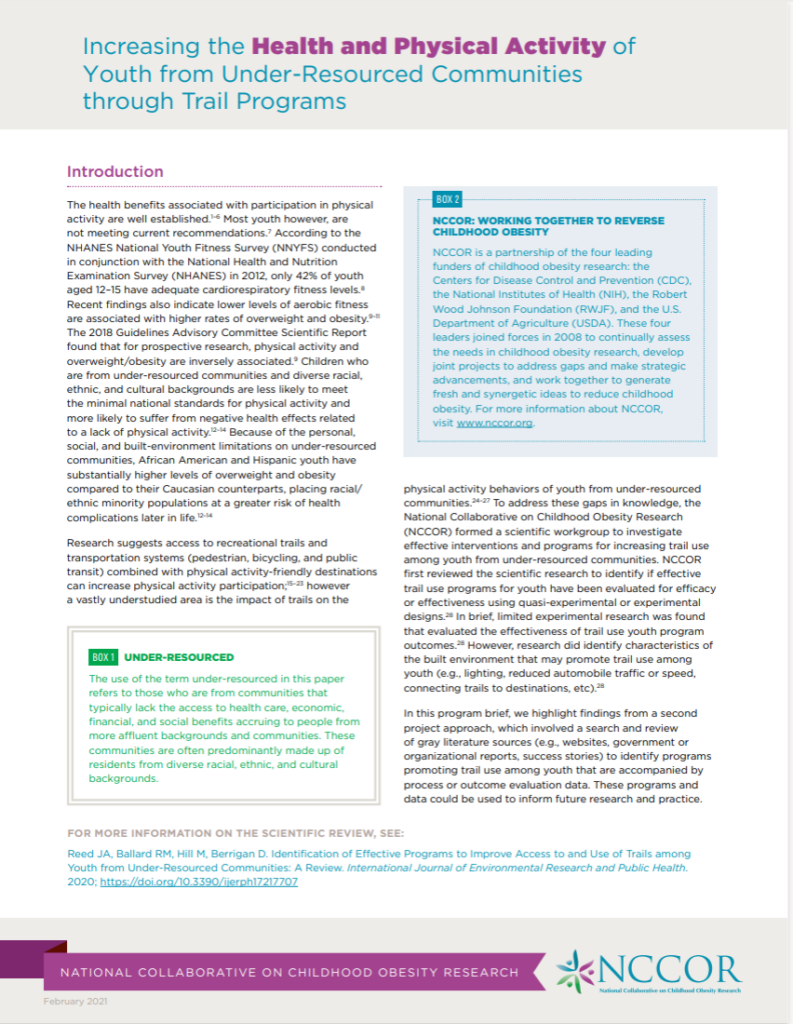
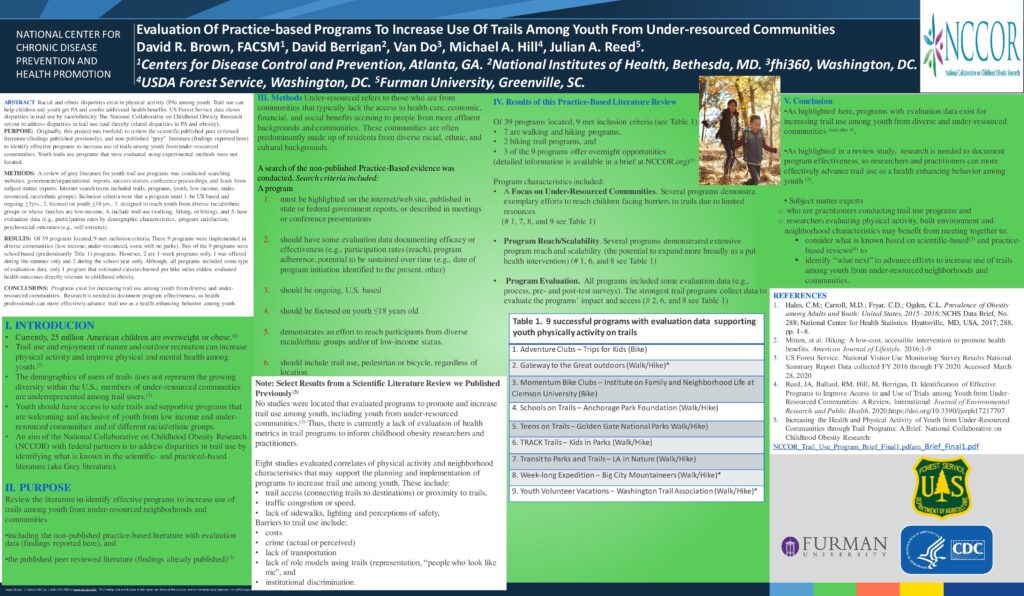
Reed JA, Ballard RM, Hill M, Berrigan D. Identification of Effective Programs to Improve Access to and Use of Trails among Youth from Under-Resourced Communities: A Review. International Journal of Environmental Research and Public Health. 2020; https://doi.org/10.3390/ijerph17217707
2020 | Advancing Measurement for Childhood Obesity
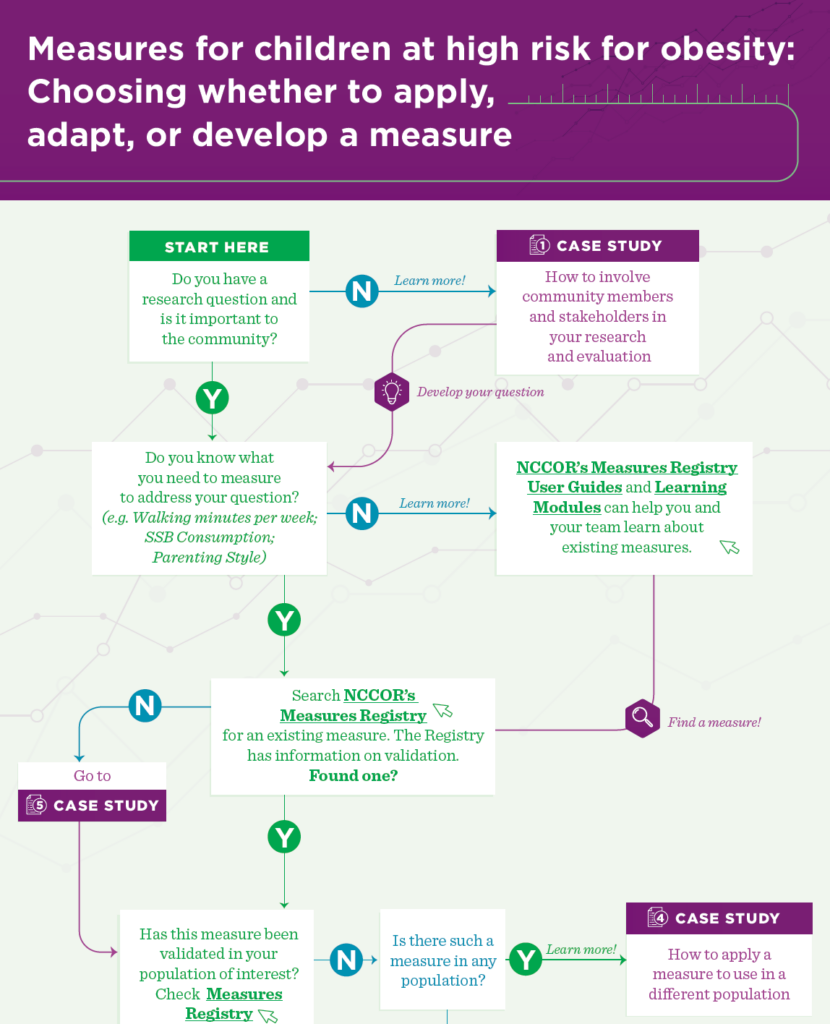
Foti, KF, Perez, CL, Knapp, EA, et al. Identification of Measurement Needs to Prevent Childhood Obesity in High-Risk Populations and Environments. Am J Prev Med. 2020 Available at https://doi.org/10.1016/j.amepre.2020.05.012
2020 | Childhood Obesity Evidence Base: Test of a Novel Taxonomic Meta-Analytic Method
Young-Hyman D, Kettel Khan L. Childhood Obesity Evidence Base Project: Building translational capacity through meta-analytic methods. Childhood Obesity. 2020. https://doi.org/10.1089/chi.2020.0140
2020 | Childhood Obesity Evidence Base: Test of a Novel Taxonomic Meta-Analytic Method
Scott-Sheldon LAJ, Hedges LV, Cyr C, et al. Childhood Obesity Evidence Base Project: A systematic review and meta-analysis of a taxonomy of intervention components to prevent obesity in children 2 to 5 years of age, 2005 to 2019. Childhood Obesity. 2020. https://doi.org/10.1089/chi.2020.0139
2020 | Childhood Obesity Evidence Base: Test of a Novel Taxonomic Meta-Analytic Method
King H, Magnus M, Hedges, LV, et al. Childhood Obesity Evidence Base Project: Methods for taxonomy development for application in taxonomic meta-analysis. Childhood Obesity. 2020. https://doi.org/10.1089/chi.2020.0138
2020 | Childhood Obesity Evidence Base: Test of a Novel Taxonomic Meta-Analytic Method
Hedges L, Saul J, Cyr C, et al. Childhood Obesity Evidence Base Project: A Rationale for Taxonomic vs Conventional Meta-analysis. Childhood Obesity. 2020. https://doi.org/10.1089/chi.2020.0137

2018 | NCCOR Partnership
Ballard, RM, Rodgers, AB, Kettel Khan, L, et al. Developing a partnership for change: The National Collaborative on Childhood Obesity Research. Am J Prev Med. 2018 Mar;54(3):465-474. https://doi.org/10.1016/j.amepre.2017.12.001


2018 | The Healthy Communities Study
Kumanyika, SK. Supplement overview: What the Healthy Communities Study is telling us about childhood obesity prevention in U.S. communities. Pediatr Obes. 2018 Oct;13 Suppl 1:3-6. https://doi.org/10.1111/ijpo.12478 (This supplement includes 15 additional articles detailing findings of the Healthy Communities Study.)
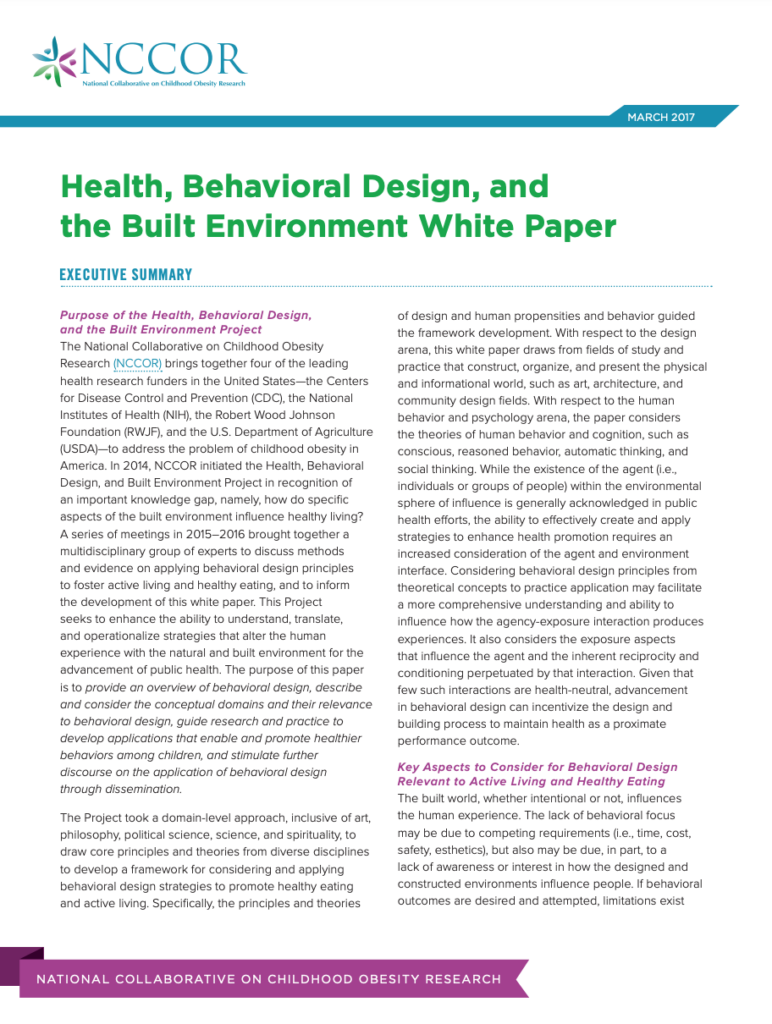
2018 | Health, Behavioral Design, and the Built Environment
Karpyn, A. (Ed.) Behavioral Design as an Emerging Theory for Dietary Behavior Change. In: Food and Public Health: A Practical Introduction. New York: Oxford University Press; 2018.
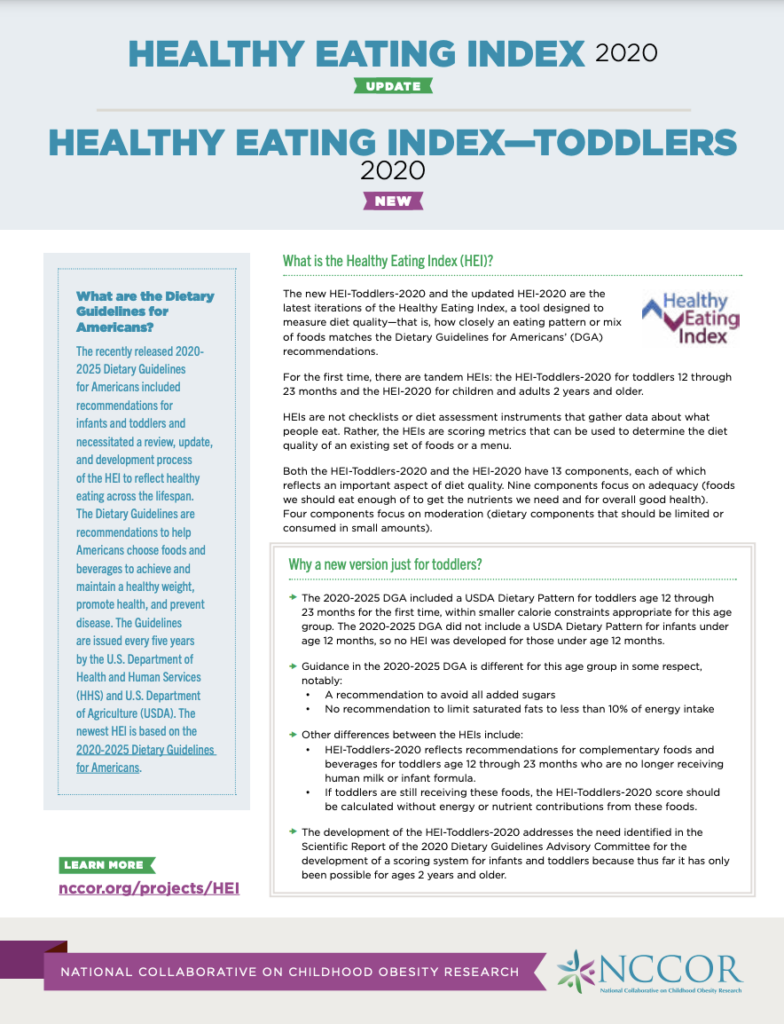
2018 | Healthy Eating Index
Millen, B. Nutrition research advances and practice innovations: The future is very bright. J Acad Nutr Diet. 2018 Sep;118(9):1587-1590. https://doi.org/10.1016/j.jand.2018.05.018
2018 | Healthy Eating Index
Reedy, J, Lerman, JL, Krebs-Smith, SM, et al. Evaluation of the Healthy Eating Index-2015. J Acad Nutr Diet. 2018 Sep;118(9):1622-1633. https://doi.org/10.1016/j.jand.2018.05.019
2018 | Healthy Eating Index
Krebs-Smith, SM, Pannucci, TE, Subar, AF, et al. Update of the Healthy Eating Index: HEI-2015. J Acad Nutr Diet. 2018 Sep;118(9):1591-1602. https://doi.org/10.1016/j.jand.2018.05.021
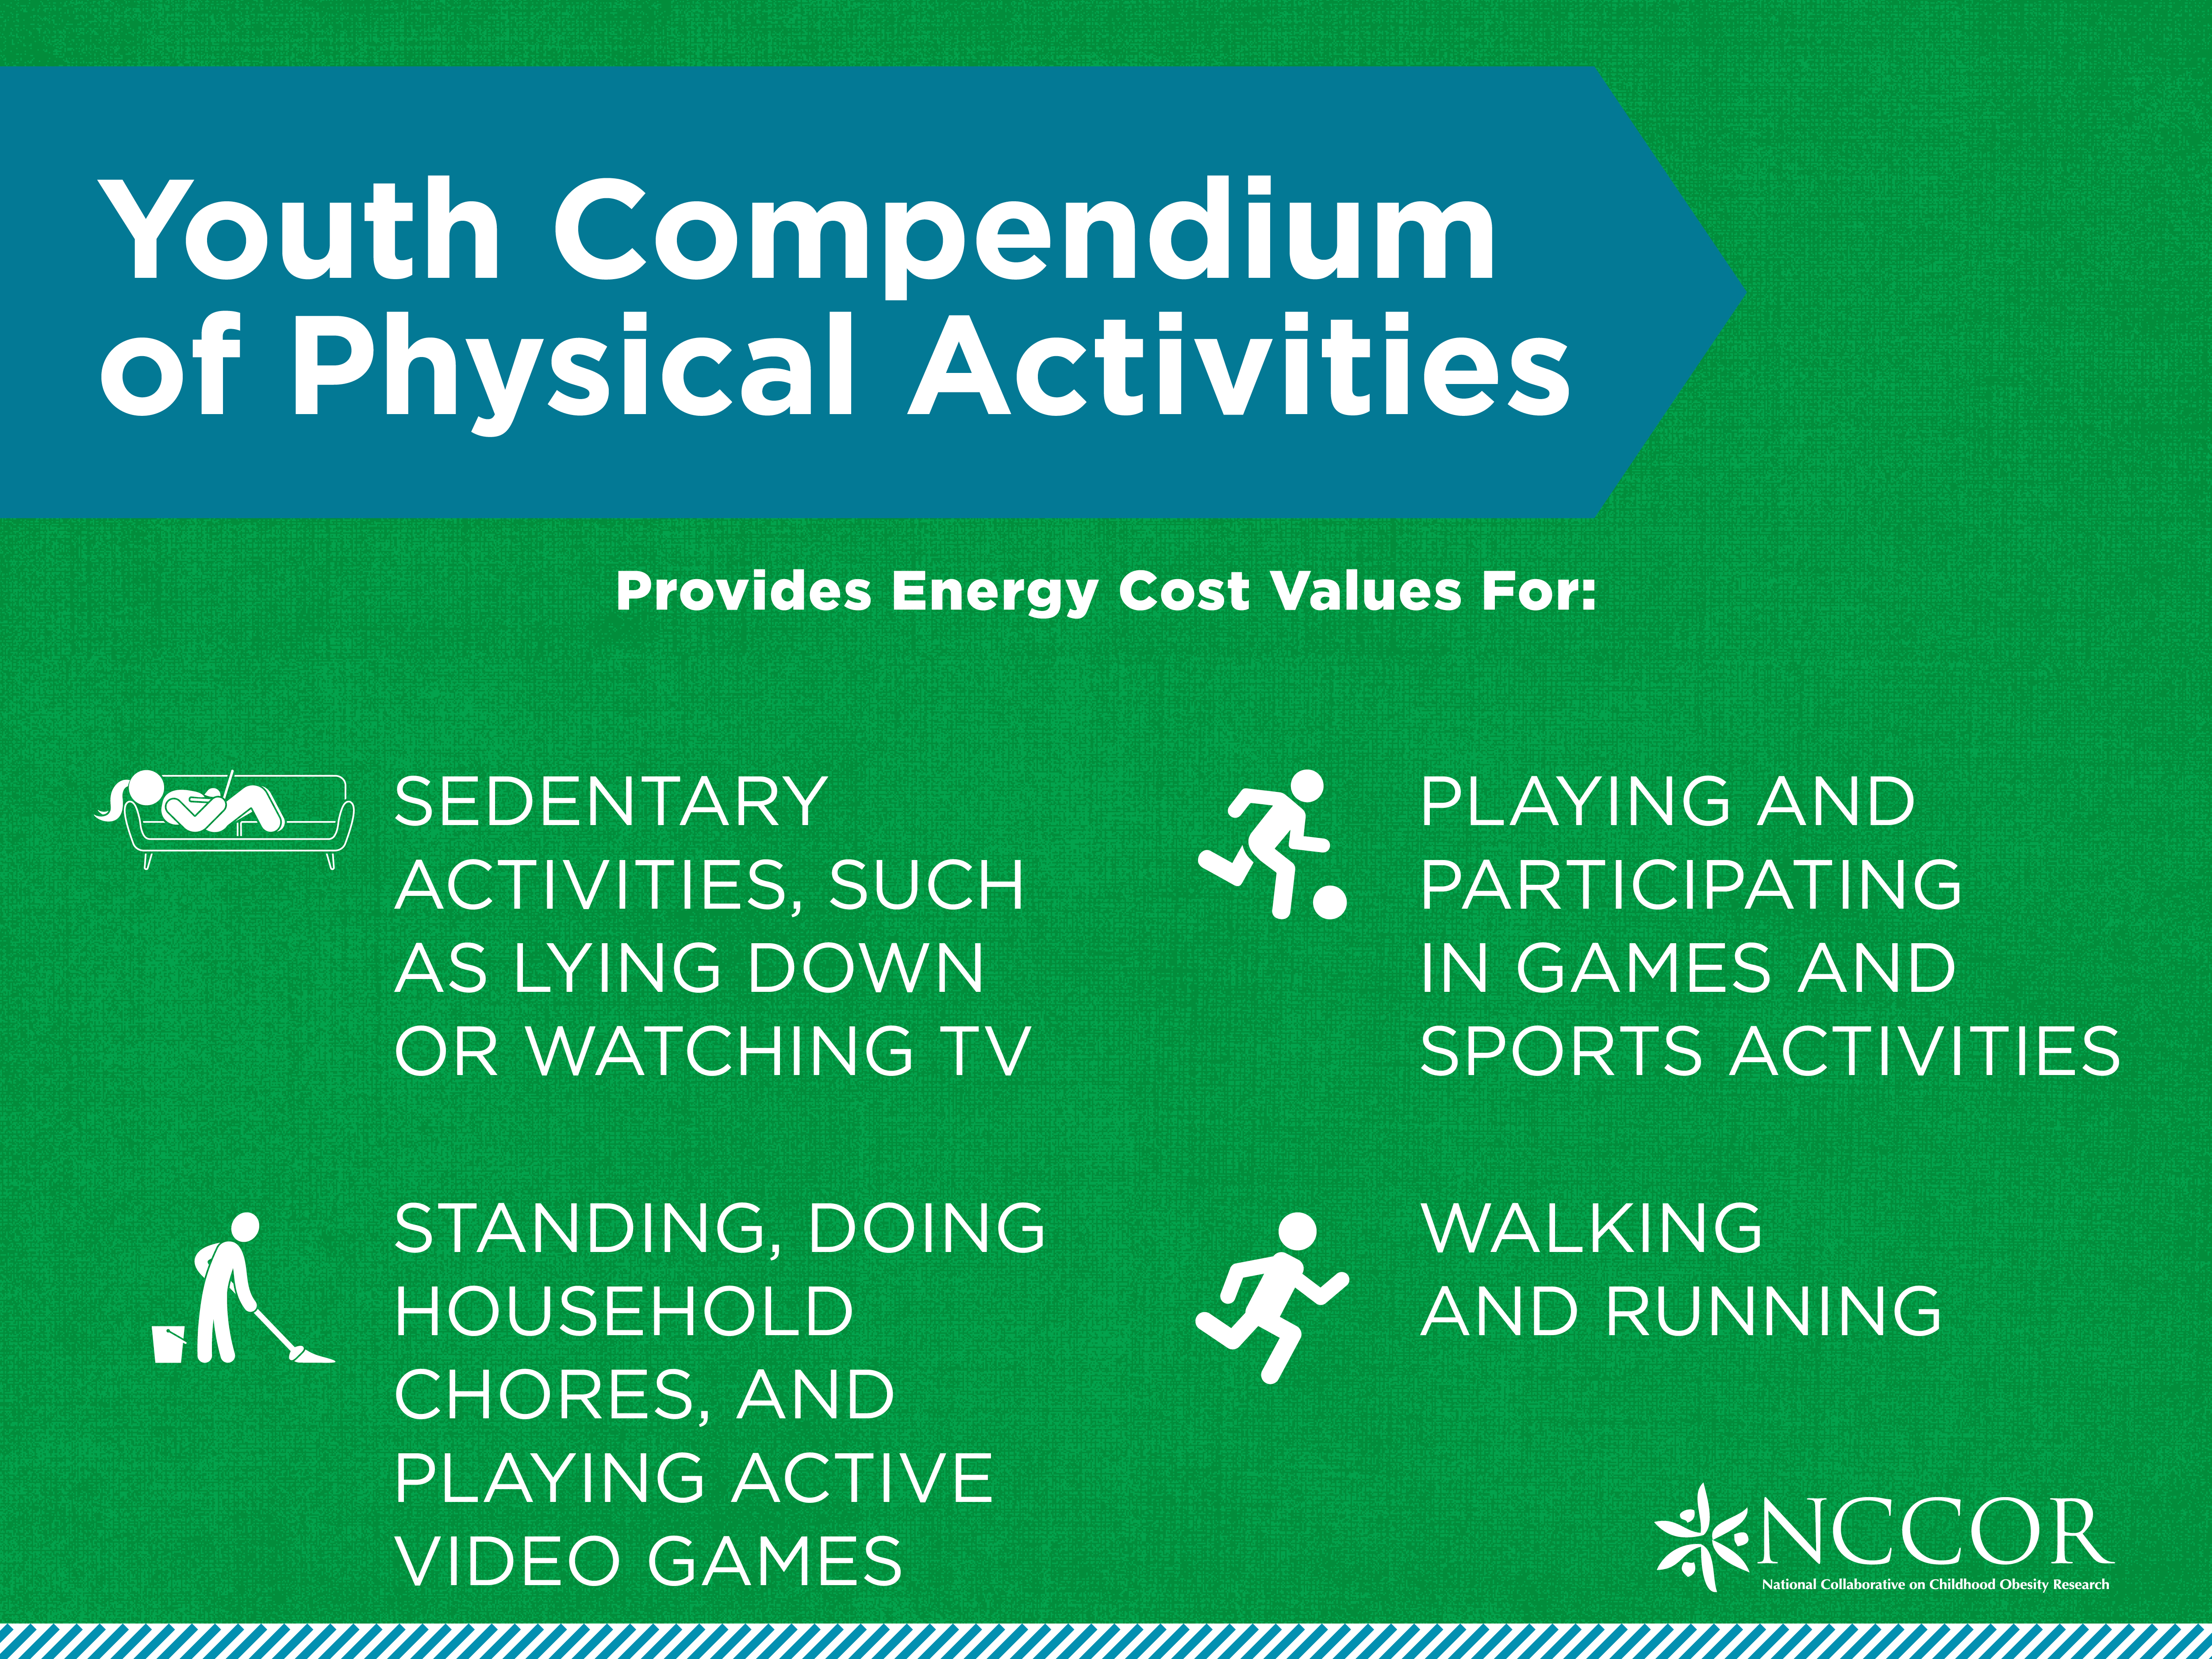
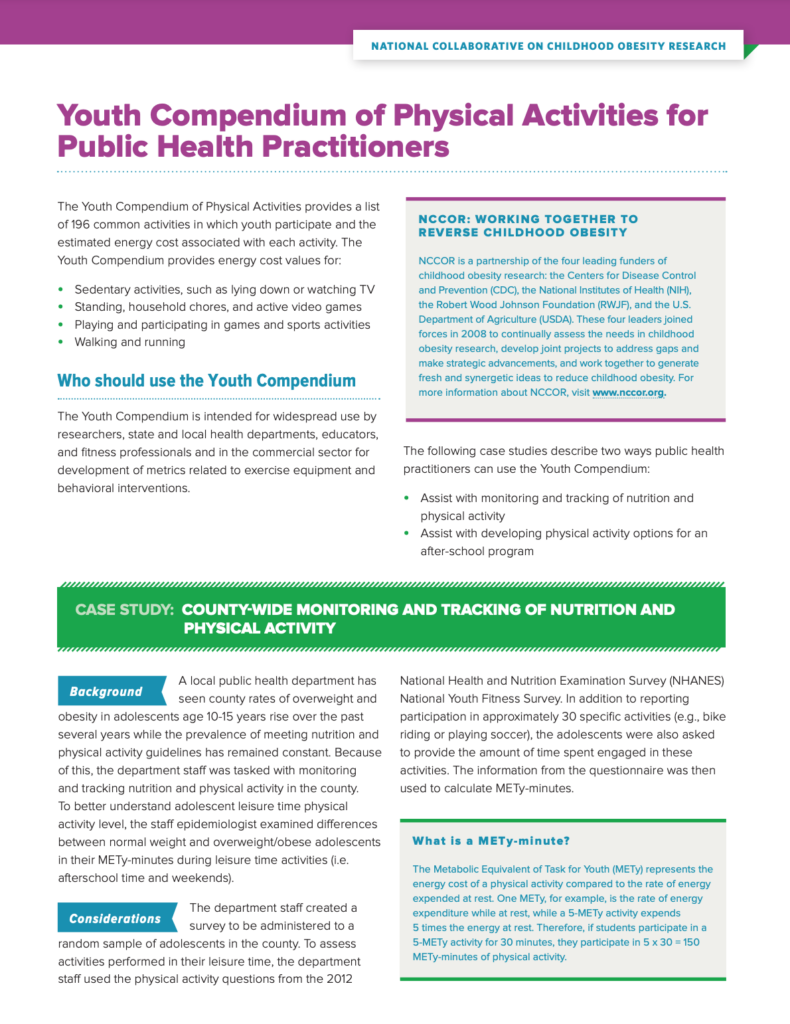
2018 | Youth Compendium of Physical Activities
Ainsworth BE, Watson, KB, Ridley, K, et al. Utility of the Youth Compendium of Physical Activities. Res Q Exerc Sport. 2018 Sep;89(3):273-281. https://doi.org/10.1080/02701367.2018.1487754.
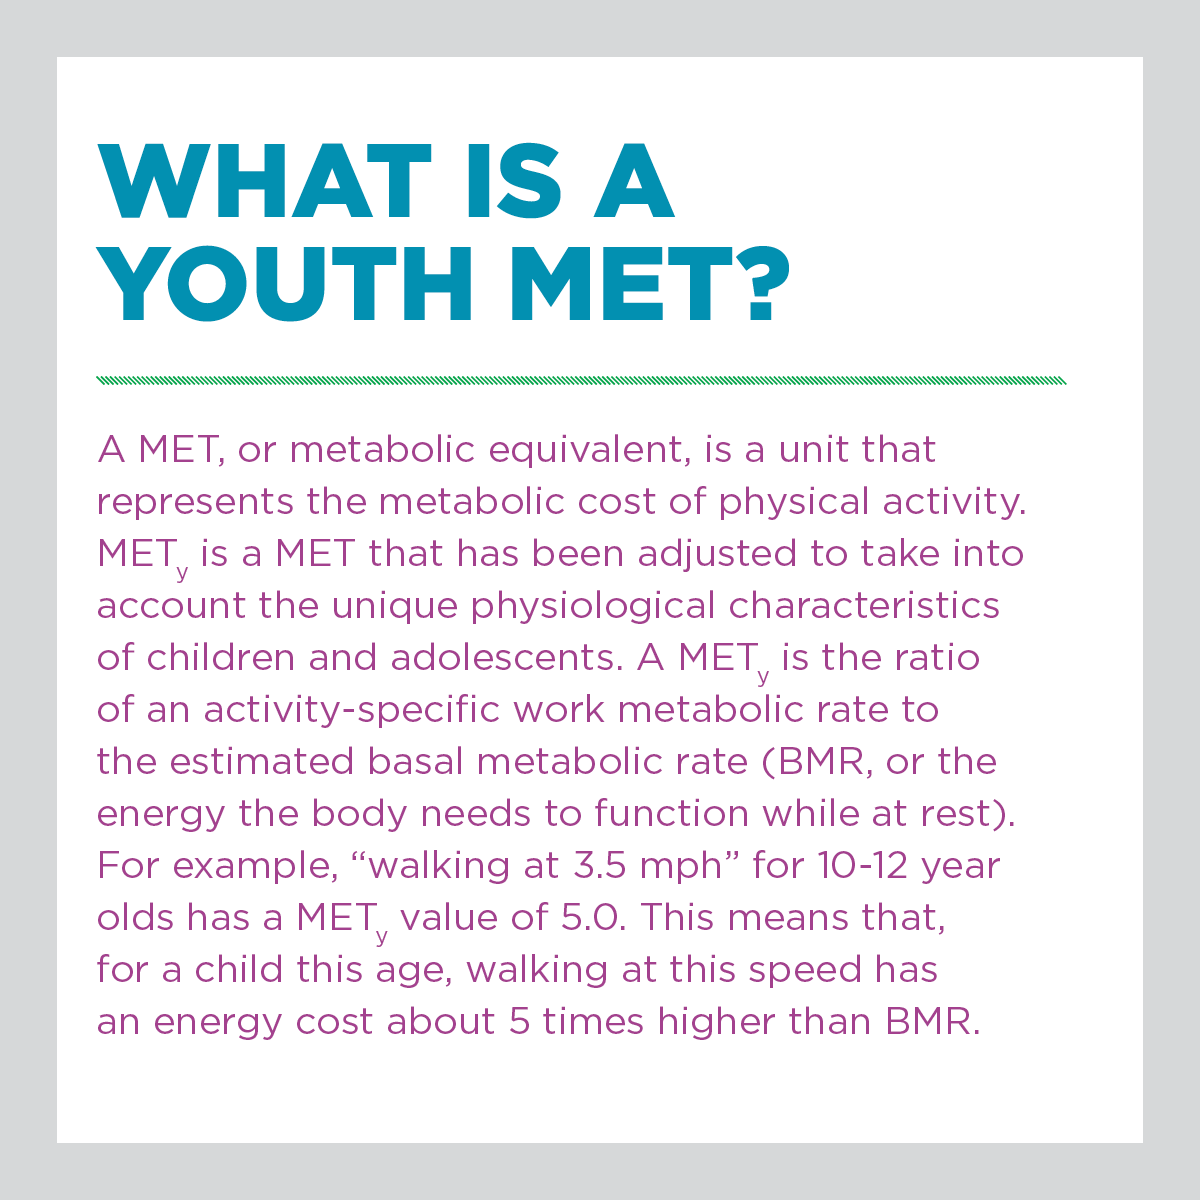
2017 | Youth Compendium of Physical Activities
Pfeiffer, KA, Watson KB, McMurray RG, et al. Energy cost expression for a youth compendium of physical activities: Rationale for using age groups. Pediatr Exerc Sci. 2018 Feb 1;30(1):142-149. https://doi.org/10.1123/pes.2016-0249

2018 | NCCOR Partnership
Sallis, JF. The value of the National Collaborative on Childhood Obesity Research: Past, present, and future. Am J Prev Med. 2018 Mar;54(3):475-477. https://doi.org/10.1016/j.amepre.2017.12.018
2018 | NCCOR Partnership
Rodgers, GP, Deitz, W, Lavizzo-Mourey, R. Research on childhood obesity: Building the foundation for a healthier future. Am J Prev Med. 2018 Mar;54(3):450-452. https://doi.org/10.1016/j.amepre.2017.08.034
2018 | NCCOR Partnership
Ballard, RM, Rodgers, AB, Kettel Khan, L, et al. A national collaborative for building the field of childhood obesity research. Am J Prev Med. 2018 Mar;54(3):453-464. https://doi.org/10.1016/j.amepre.2017.12.007
2018 | Childhood Obesity Declines
Young-Hyman, D, Morris, K, Kettel Khan, L, et al. (2018). The Childhood Obesity Declines Project: Implications for research and evaluation approaches. Child Obes. 2018 Mar;14(S1):S12-21,S40-S44. https://doi.org/10.1089/chi.2018.0023
2018 | Childhood Obesity Declines
Ottley, P, Dawkins-Lyn, N, Harris, C, et al. Childhood Obesity Declines Project: An exploratory study of strategies identified in communities reporting declines. Child Obes. 2018 Mar;14(S1):S12-21. https://doi.org/10.1089/chi.2018.0020
2018 | Childhood Obesity Declines
Kettel Khan, L, Ottley, P, Harris C, et al. Childhood Obesity Declines Project: A different methodology. Child Obes. 2018 Mar;14(S1):S5-S11. Available at https://doi.org/10.1089/chi.2018.0019
2018 | Childhood Obesity Declines
Kauh, TJ, Dawkins-Lyn, N, Dooyema, C, et al. Childhood Obesity Declines Project: An effort of the National Collaborative on Childhood Obesity Research to explore progress in four communities. Child Obes. 2018 Mar;14(S1):S1-S4. Available at https://doi.org/10.1089/chi.2018.0018
2018 | Childhood Obesity Declines
Jernigan, J, Kettel Khan, L, Dooyema, C, et al. Childhood Obesity Declines Project: Highlights of community strategies and policies. Child Obes. 2018 Mar;14(S1):S12-21,S32-S39. https://doi.org/10.1089/chi.2018.0022
2018 | Childhood Obesity Declines
Dooyema, C, Jernigan, J, Warnock, AL, et al. The Childhood Obesity Declines Project: A review of enacted policies. Child Obes. 2018 Mar;14(S1):S12-21,S22-S31. https://doi.org/10.1089/chi.2018.0021
2017 | Youth Compendium of Physical Activities
Butte, NF, Watson, KB, Ridley, K, et al. A youth compendium of physical activities: Activity codes and metabolic intensities. Med Sci Sports Exerc. 2018 Feb;50(2):246-256. Available at https://doi.org/10.1249/MSS.0000000000001430
2017 | Childhood Obesity Research Demonstration (CORD)
Dooyema, CA, Belay, B, Blanck, H.M. Implementation of multisetting interventions to address childhood obesity in diverse, lower-income communities: CDC’s Childhood Obesity Research Demonstration Projects. Prev Chronic Dis. 2017 Dec 21;14:E140. https://doi.org/10.5888/pcd14.170491 (This issue included three additional articles about CORD.)
2017 | The Healthy Communities Study
Frongillo EA, Fawcett, SB, Ritchie, L., et al. Community policies and programs to prevent obesity and child adiposity. Am J Prev Med. 2017 Nov;53(5):576-583. https://doi.org/10.1016/j.amepre.2017.05.006
2017 | Childhood Obesity Research Demonstration (CORD)
Butte, NF, Hoelscher, DM, Barlow, SE, et al. Efficacy of a community- versus primary care–centered program for childhood obesity: TX CORD RCT, Obesity (Silver Spring). 2017 Sep;25(9):1584-1593. https://doi.org/10.1002/oby.21929 (This issue included three additional articles about CORD. Two additional articles were also published about CORD in 2017.)


2016 | Youth Compendium of Physical Activities
Herrmann, S, Pfeiffer, KA. New data for an updated youth energy expenditure compendium: An introduction. J Phys Act Health. 13(6 Suppl 1), pp. S1–S2. http://dx.doi.org/10.1123/jpah.2016-0405 (This supplement included 17 papers reporting values of energy expenditure for diverse youth activities.)
2016 | Economics and Obesity
McKinnon, RA, Siddiqi, SM, Chaloupka, FJ, et al. Obesity-related policy/environmental interventions: A systematic review of economic analyses. Am J Prev Med. 2016 Apr;50(4):543-549. https://doi.org/10.1016/j.amepre.2015.10.021
2015 | The Healthy Communities Study
Arteaga, SS, Loria, CM, Crawford, PB, et al. The Healthy Communities Study: Its rationale, aims, and approach. Am J Prev Med. 2015 Oct;49(4):615-23. https://doi.org/10.1016/j.amepre.2015.06.029 (This supplement includes six additional articles that detail the methods of the Healthy Communities Study.)
2015 | Youth Compendium of Physical Activities
McMurray, RG, Butte, NF, Crouter, SE, et al. Exploring metrics to express energy expenditure of physical activity in youth. PLoS One. 2015 Jun 23;10(6):e0130869. Available at https://doi.org/10.1371/journal.pone.0130869
2015 | Envision
Deitz, WH, Baur, LA, Hall, K, et al. Management of obesity: Improvement of health-care training and systems for prevention and care. Lancet. 2015 Jun 20;385(9986):2521-33.
2015 | Envision
Swinburn, B, Kraak, V, Rutter, H, et al. Strengthening accountability systems to create healthy food environments and reduce global obesity. Lancet. 2015 June 20;385(9986):2534-2345. https://doi.org/10.1016/S0140-6736(14)61747-5
2015 | Childhood Obesity Research Demonstration (CORD)
Williams, N. Dooyema, CA, Foltz, JL, et al. The Childhood Obesity Research Demonstration Project: A team approach for supporting a multisite, multisector intervention. Child Obes. 2015 Feb;11(1):104-8. https://doi.org/10.1089/chi.2014.0063 (This supplement includes nine additional articles that provide an overview of CORD. Three additional articles on CORD were published in 2015.)
2015 | Envision
Lobstein, T, Jackson-Leach, R, Moodie, ML, et al. Child and adolescent obesity: Part of a bigger picture. Lancet. 2015 Jun 20;385(9986):2510-20. https://doi.org/10.1016/S0140-6736(14)61746-3
2015 | Healthy Eating Index
Miller, PE, Reedy, J, Kirkpatrick, SI, et al. The United States food supply Is not consistent with dietary guidance: Evidence from an evaluation using the Healthy Eating Index-2010. J Acad Nutr Diet. 2015 Jan;115(1):95-100. https://doi.org/10.1016/j.jand.2014.08.030
2014 | Envision
Mabry, PL, Bures, RM. Systems science for obesity-related research questions: An introduction to the theme issue. Am J Public Health. 2014 July;104(7):1157–1159. https://dx.doi.org/10.2105%2FAJPH.2014.302083
2014 | Envision
Fallah-Fini, S, Rahmandad, H, Huang, T, et al. Modeling US adult obesity trends: A system dynamics model for estimating energy imbalance gap. Am J Public Health. 2014 Jul;104(7):1230-9. https://doi.org/10.2105/AJPH.2014.301882
2014 | Envision
Bures, RM, Mabry, PL, Orleans, CT, et al. Systems science: A tool for understanding obesity. Am J Public Health. 2014 July;104(7):1156. https://doi.org/10.0.8.57/AJPH.2014.302082
2014 | Envision
Basu, S, Seligman, H, Winkleby, M. A metabolic–epidemiological microsimulation model to estimate the changes in energy intake and physical activity necessary to meet the Healthy People 2020 obesity objective. Am J Public Health. 2014 Jul;104(7):1209-16. https://doi.org/10.2105/AJPH.2013.301674
2014 | The Johns Hopkins Global Obesity Prevention Center (GOPC)
Fallah-Fini, S, Rahmandad, H, Huang, T, et al. Modeling U.S. adult obesity trends: A system dynamics model for estimating energy imbalance gap. Am J Public Health. 2014 July;104(7):1230–1239. doi.org/10.2105/AJPH.2014.301882 (GOPC has published more than 60 additional articles using systems science to assess key contributing factors associated with obesity. http://www.globalobesity.org/about-the-gopc/our-publications/index.html)
2014 | Envision
Zhang, D, Giabbanelli, PJ, Arah, OA, et al. Impact of different policies on unhealthy dietary behaviors in an urban adult population: An agent-based simulation model. Am J Public Health. 2014 Jul;104(7):1217-22. Available at https://10.2105/AJPH.2014.301934
2014 | Envision
Savage, JS, Downs, DS, Dong, Y, et al. Control systems engineering for optimizing a prenatal weight gain intervention to regulate infant birth weight. Am J Public Health. 2014 Jul;104(7):1247-54 https://doi.org/10.2105/AJPH.2014.301959
2014 | Envision
Sabounchi, NS, Hovmand, PS, Osgood, ND, et al. A novel system dynamics model of female obesity and fertility. Am J Public Health. 2014 Jul;104(7):1240-6. https://doi.org/10.2105/AJPH.2014.301898
2014 | Envision
Rendall, MS, Weden, MM, Lau, C, et al. Evaluation of bias in estimates of early childhood obesity from parent-reported heights and weights. Am J Public Health. 2014 July; 104(7): 1255–1262. https://dx.doi.org/10.2105%2FAJPH.2014.302001
2014 | Envision
Schaefer, DR, Simpkins, SD. Using social network analysis to clarify the role of obesity in selection of adolescent friends. Am J Public Health. 2014 Jul;104(7):1223-9. https://doi.org/10.2105/AJPH.2013.301768

2014 | Healthy Eating Index
Guenther, PM, Kirkpatrick, SI, Reedy, J, et al. The Healthy Eating Index-2010 Is a valid measure of diet quality according to the 2010 Dietary Guidelines for Americans. J Nutr. 2014 Mar;144(3):399-407. https://doi.org/10.3945/jn.113.183079

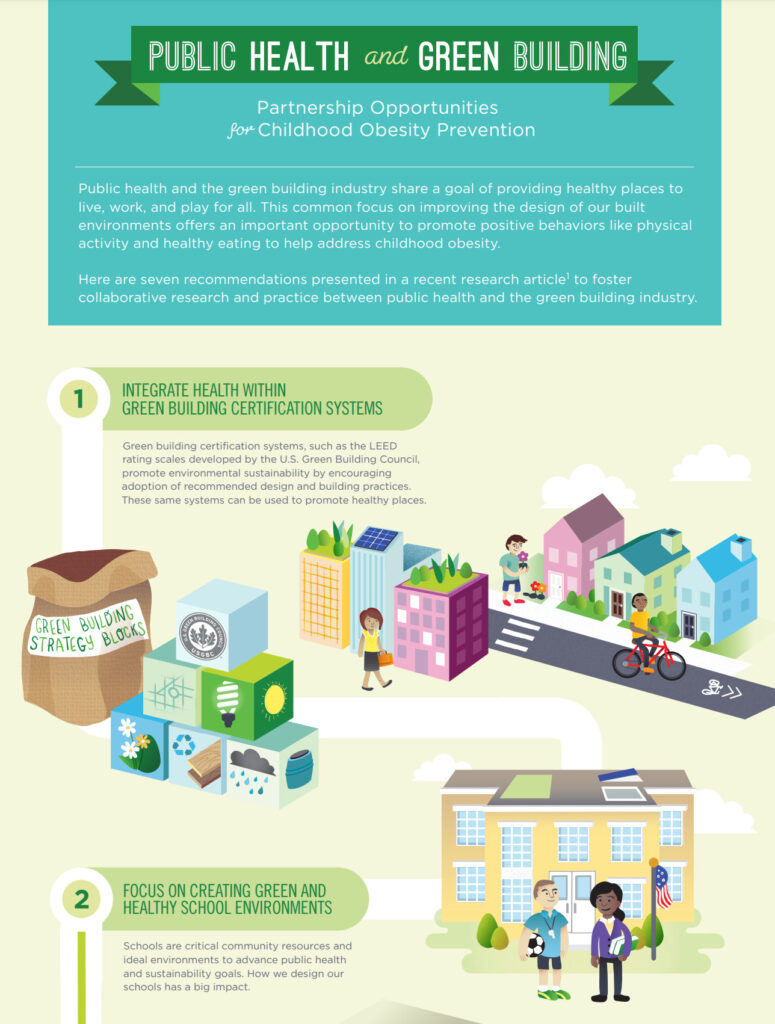
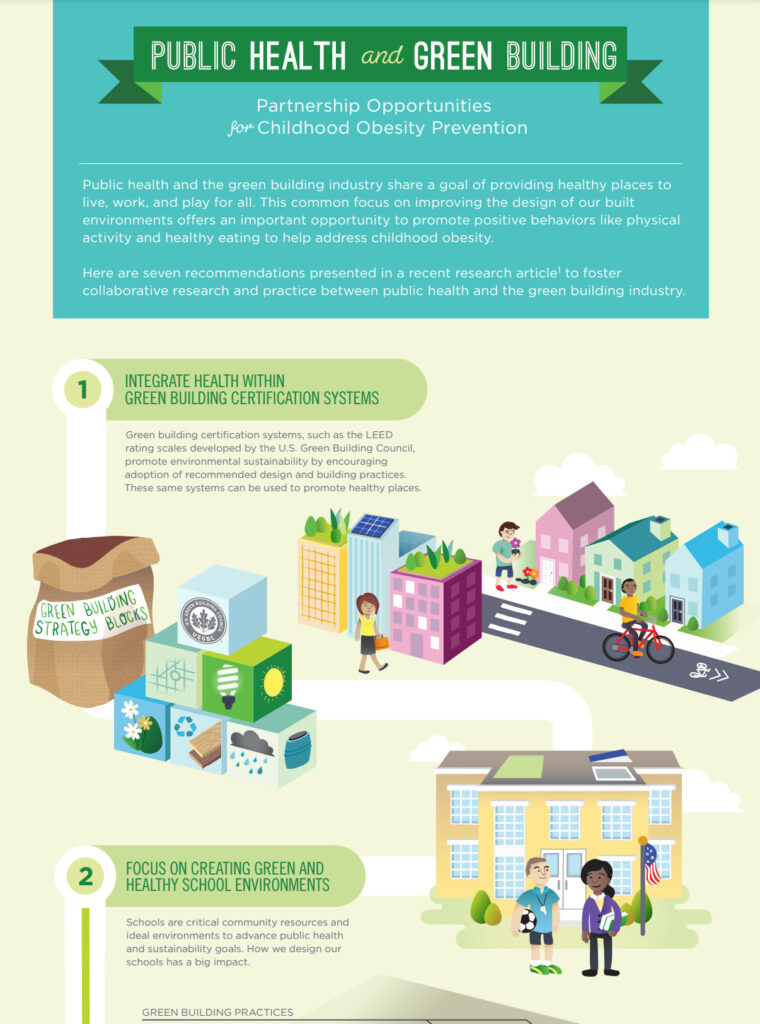
2013 | Green Health
Trowbridge, MJ, Huang, TT, Botchwey, ND, et al. Public health and the green building industry: Partnership opportunities for childhood obesity prevention. Am J Prev Med. 2013 May;44(5):489-95. https://doi.org/10.1016/j.amepre.2013.01.010v
2013 | Healthy Eating Index
Guenther, PM, Casavale, KO, Reedy, J, et al. Update of the Healthy Eating Index: HEI-2010. J Acad Nutr Diet. 2013 Apr;113(4):569-80. https://10.1016/j.jand.2012.12.016

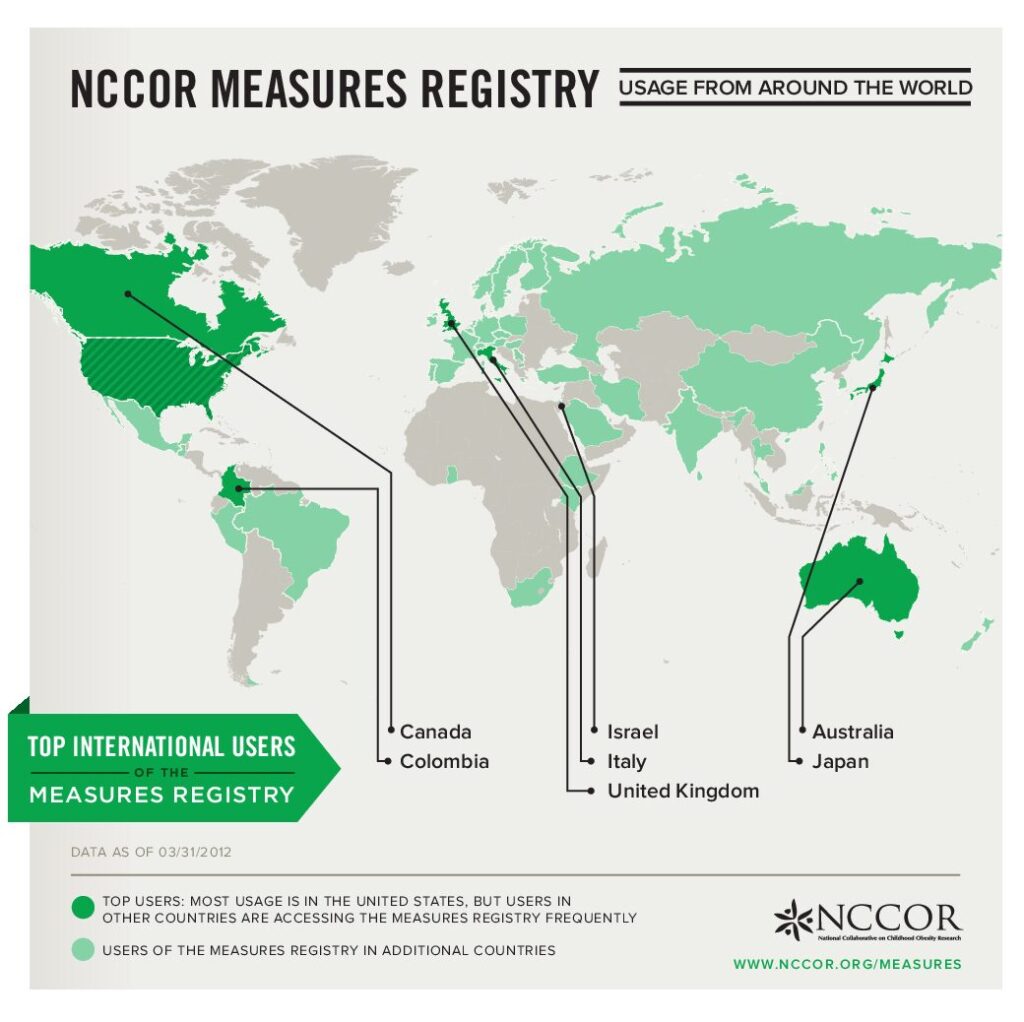
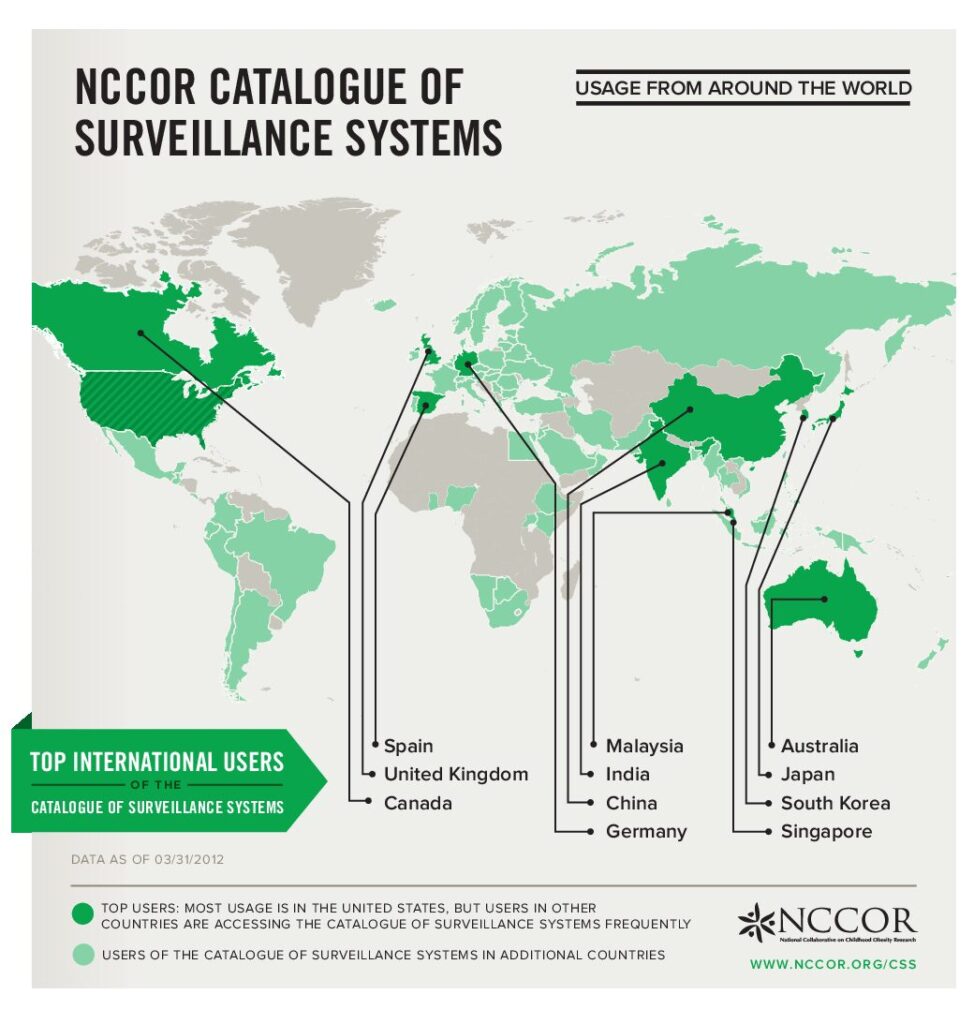
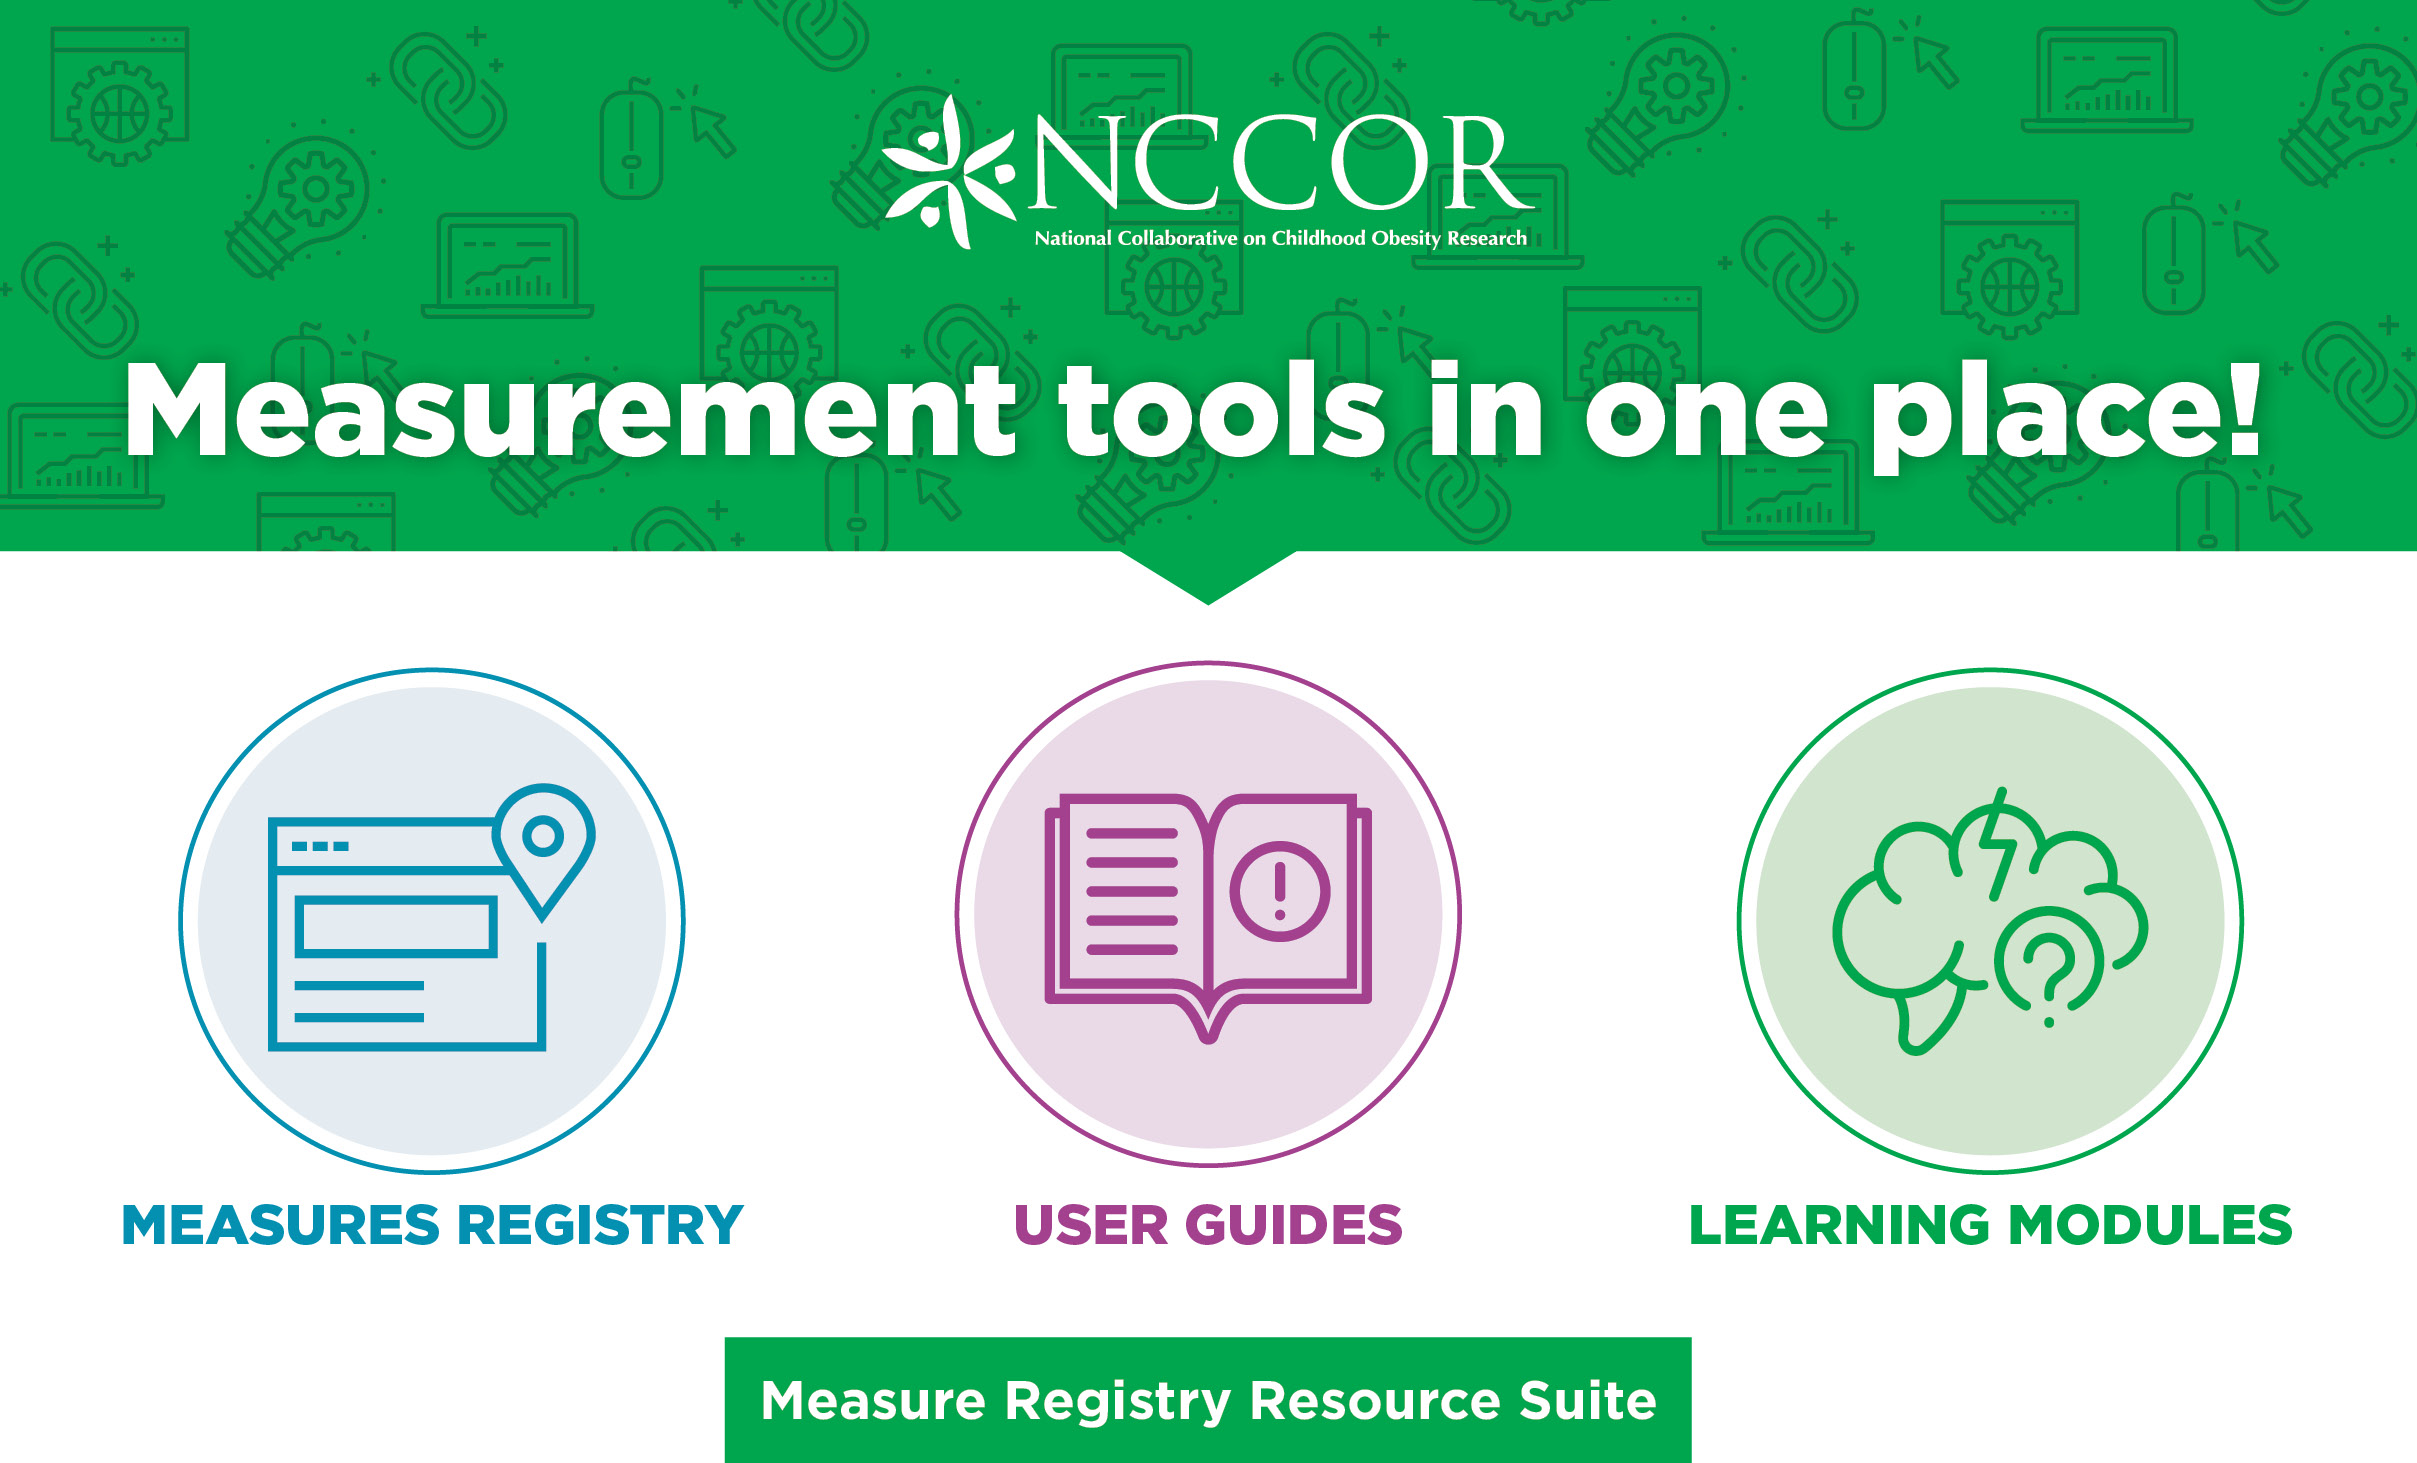
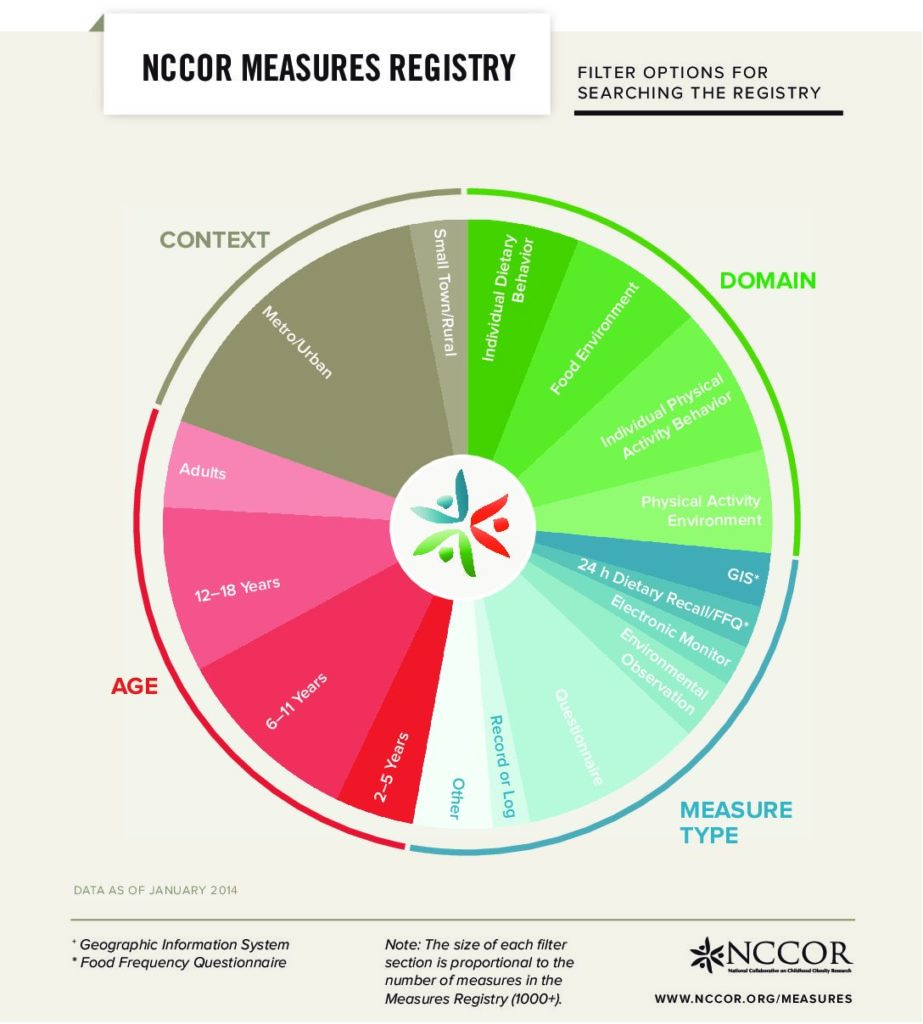
2012 | Measures Registry and Catalogue of Surveillance Systems
McKinnon, RA, Reedy, J, Berrigan, D, et al. The National Collaborative on Childhood Obesity Research Catalogue of Surveillance Systems and Measures Registry: New tools to spur innovation and increase productivity in childhood obesity research. Am J Prev Med. 2012 Apr;42(4):433-5. https://10.1016/j.amepre.2012.01.004
2011 | Envision
Wang, YC, McPherson, K, Marsh, T, et al. Health and economic burden of the projected obesity trends in the USA and UK. Lancet. 2011 Aug 27;378(9793):815-25. https://doi.org/10.1016/S0140-6736(11)60814-3
2011 | Envision
Swinburn, BA, Sacks, G, Hall, KD, et al. The global obesity pandemic: Shaped by global drivers and local environments. Lancet. 2011 Aug 27;378(9793):804-14. https://doi.org/10.1016/S0140-6736(11)60813-1
2011 | Envision
Rutter, H. Where next for obesity? Lancet. 2011 Aug 27;378(9793):746-7. https://doi.org/10.1016/S0140-6736(11)61272-5
2011 | Envision
Kling, D. The future challenge of obesity. Lancet. 2011 Aug 27;378(9793):743-4. https://doi.org/10.1016/S0140-6736(11)61261-0
2011 |
Hall, KD, Sacks, G, Chandramohan, D, et al. Quantification of the effect of energy imbalance on body weight. Lancet. 2011 Aug 27;378(9793):826-37. https://doi.org/10.1016/S0140-6736(11)60812-X
2011 | Envision
Gortmaker, SL, Swinburn, BA, Levy, D, et al. Changing the future of obesity: Science, policy, and action. Lancet. 2011 Aug 27;378(9793):838–847. https://doi.org/10.1016/S0140-6736(11)60815-5
2011 | Envision
Deitz, WH. Reversing the tide of obesity. Lancet. 2011 Aug 27;378(9793):744-6. https://doi.org/10.1016/S0140-6736(11)61218-X